Advanced materials research continues to move toward smaller feature sizes, higher material sensitivities, and increasingly complex analytical workflows. As a result, the ability to isolate and transfer microscopic particles without contamination has become a critical requirement across battery development, semiconductor manufacturing, nanotechnology, failure analysis, and reactive chemical analysis. Conventional sampling approaches performed in ambient environments often expose sensitive samples to oxygen, moisture, electrostatic interference, and particulate contamination, which can compromise analytical integrity before characterization begins. The challenge becomes even more significant when researchers must isolate individual particles, fibers, powders, or inclusions at the micrometer scale within controlled inert environments. Targeted micro-sampling inside glove boxes addresses these limitations by combining precision micromanipulation systems, high-magnification microscopy, and contamination-controlled inert atmospheres. These integrated systems enable accurate, repeatable, and non-destructive particle isolation for downstream analytical techniques such as Raman microscopy, FTIR microscopy, SEM, and elemental analysis. This post discusses contamination-free micro-sampling inside glove boxes and precision micromanipulation, highlighting instruments and techniques for accurate particle isolation and transfer.
Challenges in Targeted Micro-Sampling
Isolating microscopic particles inside glove boxes presents unique operational and analytical challenges, particularly when dealing with fragile, reactive, or heterogeneous materials.
Key technical challenges include:
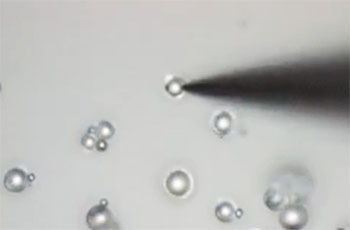
- Single-Particle Isolation: Microscopic particles are often embedded within dense powder beds, mixed particulate systems, or heterogeneous material matrices. Isolating a single target particle requires extremely precise positional control and carefully regulated extraction force. This becomes particularly difficult when particles exhibit similar morphology, irregular geometry, or electrostatic interactions with neighboring material. In many analytical workflows, the inability to selectively isolate an individual particle can result in mixed-sample contamination and inaccurate characterization results.
- Contamination Risks: Contamination control is one of the most critical requirements in targeted micro-sampling workflows. Sensitive particles can easily be altered by exposure to atmospheric gases, residual contaminants, or improper transfer procedures. Common contamination sources include:
- Ambient oxygen or moisture ingress
- Transfer-induced contamination during handling
- Residual contamination from sampling tools
- Cross-contamination from surrounding particles
- Electrostatic attraction of airborne particulates
Even trace contamination can significantly affect downstream analytical techniques such as Raman spectroscopy, FTIR microscopy, SEM imaging, or elemental analysis. In high-sensitivity applications, contamination artifacts may generate misleading spectral signatures or inaccurate compositional data.
- Sample Integrity Preservation: Many advanced materials used in battery research, semiconductor manufacturing, and nanotechnology are highly sensitive to environmental exposure and mechanical stress. Improper sampling or transfer procedures can permanently alter material chemistry or morphology before analysis is performed. Key risks include:
- Surface oxidation of reactive materials
- Structural deformation during extraction
- Moisture absorption in hygroscopic compounds
- Electrochemical degradation of battery materials
- Thermal instability in sensitive particulates
- Visualization and Positioning Limitations: Accurate micro-sampling depends heavily on stable, high-resolution visualization systems. Operators must precisely identify, target, and manipulate particles that may only measure a few microns in diameter. Effective sampling workflows typically require:
- High-magnification optical or digital imaging
- Stable focal positioning during manipulation
- Accurate depth perception at micro-scale dimensions
- Controlled illumination for particle visibility
Inside glove boxes, visualization challenges become more pronounced due to restricted operator movement, limited tactile feedback, and constrained working distances. Without integrated microscopy and precision positioning systems, accurate particle targeting and extraction become extremely difficult.
How Targeted Micro-Sampling Works Inside Glove Boxes
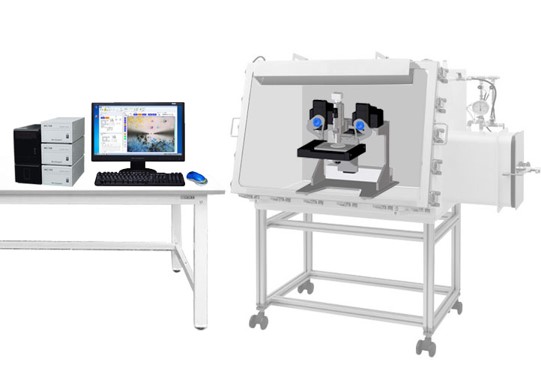
Targeted micro-sampling systems combine precision micromanipulation technologies, high-resolution microscopy, and specialized extraction tools to isolate microscopic particles inside glove box environments. These workflows are designed to minimize contamination, preserve sample integrity, and support reliable downstream characterization. Key steps involved are as follows:
Step 1: Particle Identification
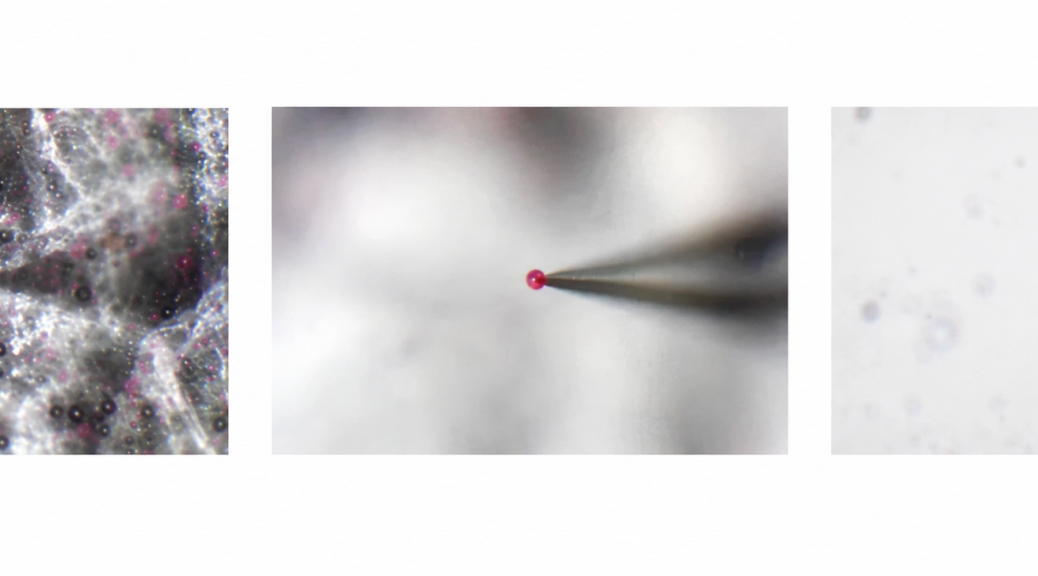
The micro-sampling workflow begins with identification of the target particle using high-resolution imaging systems such as optical microscopy, digital microscopy, polarized light microscopy, or integrated camera-based platforms. Researchers identify particles based on morphology, particle size distribution, optical contrast, color variation, and surface characteristics.
Step 2: Precision Positioning
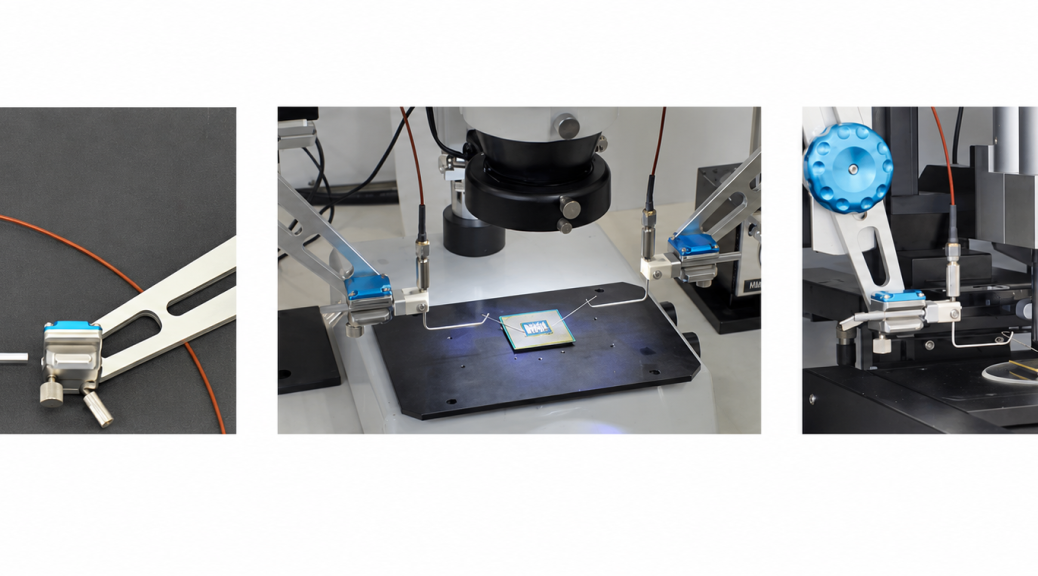
Once the target particle has been identified, precision micromanipulators are used to position the sampling tool with micron-level accuracy. These positioning systems typically provide multi-axis movement control, micron-level positioning accuracy, vibration suppression, fine incremental motion, and stable stage alignment. vibration suppression, fine incremental motion, and stable stage alignment. Motorized, mouse-controlled micromanipulators are especially suited to glove box work since they allow full operation from outside the chamber; manual systems may also be used through glove ports for simpler applications. Inside glove box environments, these systems help compensate, these systems help compensate for restricted operator movement and reduced tactile feedback during high-precision manipulation tasks.
Step 3: Micro-tool Selection
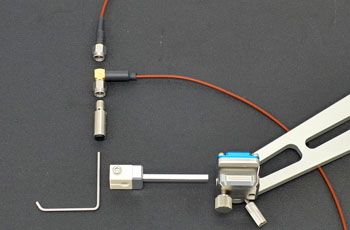
The selection of an appropriate micro-sampling tool depends on particle size, morphology, material sensitivity, and downstream analytical requirements. Commonly used tools include micro-needles for particle separation, glass probes for delicate extraction, tungsten needles for rigid materials, and additional specialized tools depending on application requirements. Proper tool selection is essential for minimizing contamination for minimizing contamination, preventing particle damage, and maintaining sampling precision throughout the extraction process.
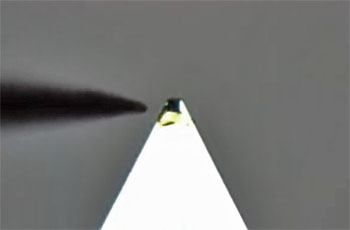
Step 4: Controlled Particle Extraction
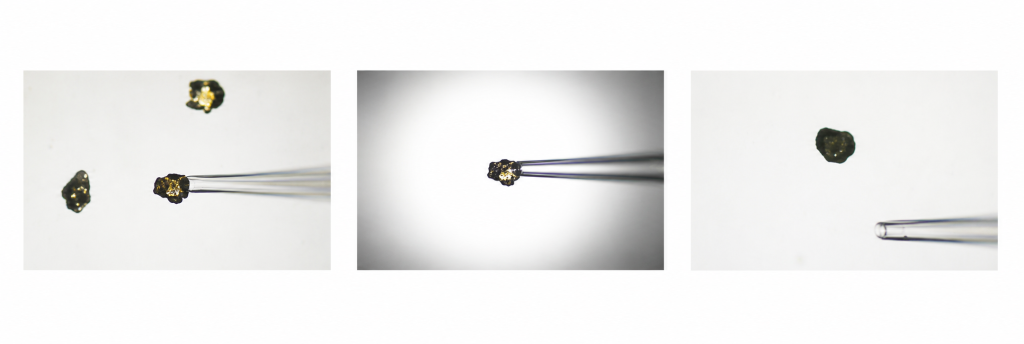
After positioning the selected micro-tool, the target particle is isolated using carefully controlled movement to minimize disturbance to surrounding material. During extraction, researchers carefully regulate mechanical force, prevent particle fragmentation, mitigate electrostatic effects that could influence particle movement, avoid disturbance to adjacent particles, and maintain environmental isolation within the glove box. Stable manipulation significantly improves extraction repeatability and reduces the risk of sample loss or contamination during handling.
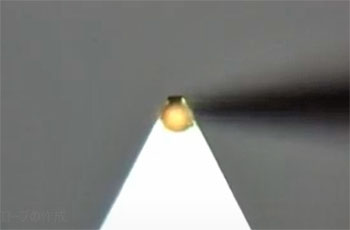
Step 5: Transfer to Analytical Platforms
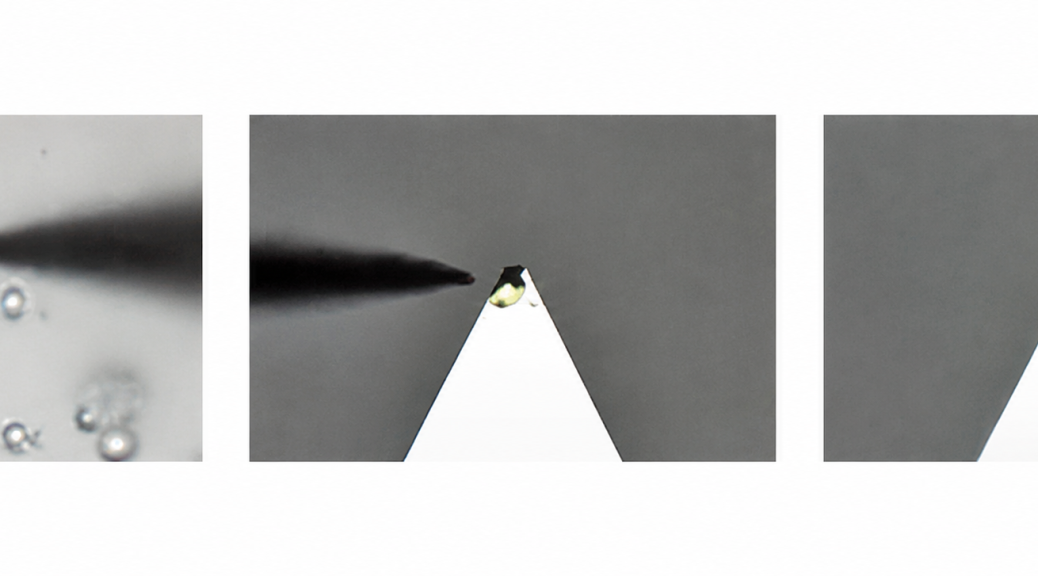
Following extraction, the isolated particle is transferred directly to downstream analytical systems for characterization while maintaining contamination-controlled conditions. Targeted micro-sampling workflows are commonly integrated with Raman microscopy, FTIR microscopy, Scanning Electron Microscopy (SEM), Energy Dispersive Spectroscopy (EDS), X-ray spectroscopy systems, and surface characterization instruments. Controlled transfer procedures help preserve sample integrity and ensure accurate analytical results throughout the characterization process.
Core Capabilities of Modern Glove Box Micro-Sampling Systems
Advanced micro-sampling platforms incorporate multiple technologies designed to optimize precision, positional stability, and contamination control inside glove box environments. Here are the key capabilities:
- Micrometer-Scale Positioning Accuracy: Modern micro-sampling systems are designed to deliver highly precise movement control at micron scales. These systems typically provide micron-level positioning resolution, fine-axis incremental movement, repeatable motion control, and high positional stability during particle manipulation. Such precision is essential when isolating particles as small as 2 microns, where even minor positioning deviations can result in sample loss, contamination, or disturbance to surrounding material.
- Vibration Isolation and Mechanical Stability: Mechanical vibration can significantly interfere with high-precision sampling operations, particularly during extraction of fragile or ultra-fine particles. To improve stability, advanced systems incorporate rigid positioning stages, vibration-damping structures, precision linear guides, and stable microscope integration platforms. Enhanced mechanical stability improves extraction accuracy, reduces unintended particle displacement, and supports repeatable sampling performance under high magnification.
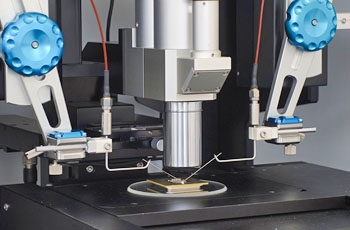
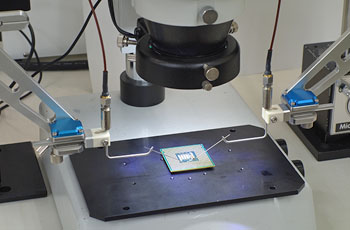
- Integrated Microscopy Compatibility: Modern micro-sampling workflows rely heavily on real-time visualization during particle identification and extraction. As a result, these systems are commonly integrated with optical microscopes, digital microscopy platforms, long working-distance objectives, and high-magnification imaging systems. Integrated visualization enables simultaneous observation and manipulation of microscopic particles, improving targeting accuracy and operator control during sampling operations.
- Glove Box-Compatible Ergonomics: Micro-sampling systems designed specifically for glove box environments are optimized to function within confined working areas and restricted operator movement conditions. These systems typically feature compact mechanical footprints, simplified operator controls, extended tool reach capabilities, reduced manual strain, and improved maneuverability through glove ports. Optimized ergonomics help researchers maintain stable positioning and improve usability during prolonged precision sampling tasks.
- Controlled and Repeatable Sampling Performance: Repeatability is critical for ensuring reliable analytical data and reproducible experimental workflows. Advanced micro-sampling systems support consistent extraction performance through controlled tool movement, repeatable positioning workflows, stable manipulation control, and reduced operator variability. These capabilities improve confidence in downstream analytical results and help maintain consistency across multiple sampling and characterization cycles.
Operations In Inert Atmospheres: The glove box allows for sampling operations to take place in an inert atmosphere where the stability of the particle or substrate can be maintained.
Instrumentation for Targeted Micro-Sampling Inside Glove Boxes
Modern targeted micro-sampling workflows rely on the following integrated instrumentation platforms to isolate microscopic particles with high positional accuracy while maintaining sample integrity throughout the analytical workflow.
- Micromanipulator Systems: Micromanipulators form the foundation of precision micro-sampling workflows by enabling stable and highly controlled particle manipulation at micron and sub-micron scales. These systems typically provide fine multi-axis positioning, controlled extraction movement, stable particle handling, and high repeatability during sampling operations.
- Specialized Sampling Tools: Micro-sampling workflows utilize specialized extraction tools selected according to particle size, morphology, material sensitivity, and analytical requirements. Commonly used tools include tungsten micro-needles for rigid materials, glass micro-probes for delicate extraction
- Analytical Systems: Targeted micro-sampling systems are commonly integrated with advanced analytical platforms to streamline the transition from particle isolation to characterization. These systems are frequently used alongside Raman microscopes, FTIR microscopes, Scanning Electron Microscopy (SEM) platforms, Energy Dispersive Spectroscopy (EDS) systems, and surface metrology instruments. Integrated workflows improve analytical efficiency while reducing contamination risk during sample transfer between instruments.
- Environmental Control and Containment Systems: Targeted micro-sampling inside glove boxes relies heavily on tightly controlled environmental systems that maintain sample integrity throughout handling and transfer. These include inert gas purification units, HEPA and ULPA filtration modules, oxygen and moisture monitoring sensors, pressure control systems, and antechamber transfer interfaces. Together, these systems ensure a stable, contamination-free environment that supports high-precision particle isolation and prevents exposure of sensitive materials to ambient conditions.These environmental systems are typically part of the laboratory’s existing glove box infrastructure, into which Barnett’s micromanipulation systems integrate
- Integrated Imaging and Sample Transfer Platforms: High-resolution imaging and controlled transfer systems are critical components of modern micro-sampling instrumentation. Digital optical microscopes, in-glove-box imaging cameras, and high-magnification inspection systems enable accurate particle localization prior to extraction. In addition, precision transfer stages, sealed transport vessels, and correlative sample holders allow isolated particles to be safely moved between glove boxes and analytical instruments such as SEM, Raman, or FTIR systems without compromising sample integrity or positional traceability.
Comparison Between Glove Box Sampling and Open Environment Sampling
Throughout targeted micro-sampling workflows, environmental control plays a critical role in preserving sample integrity and analytical accuracy. The differences between glove box sampling and open-environment sampling become especially significant when handling reactive or contamination-sensitive microscopic particles. The table below highlights the major differences between these two sampling approaches.
| Analytical Consideration | Glove Box Sampling | Open Environment Sampling |
| Oxygen Exposure | Oxygen concentrations are maintained at extremely low ppm levels to prevent oxidation and chemical degradation. | Samples are exposed directly to atmospheric oxygen during handling and transfer. |
| Moisture Exposure | Moisture levels are strictly controlled to protect hygroscopic or moisture-sensitive materials. | Samples are exposed to ambient humidity, increasing the risk of moisture absorption and instability. |
| Reactive Material Stability | Reactive materials remain chemically stable throughout sampling and transfer operations. | Reactive materials may undergo oxidation, hydrolysis, or degradation during handling. |
| Contamination Control | Sampling is performed under contamination-controlled conditions with minimal airborne particulate exposure. | Samples are more susceptible to airborne contamination, particulate deposition, and environmental interference. |
| Analytical Reliability | Controlled handling improves analytical accuracy and produces more reliable characterization results. | Environmental exposure can introduce variability and reduce analytical confidence. |
| Particle Transfer Integrity | Controlled transfer workflows help preserve particle morphology and sample integrity during movement between systems. | Manual handling increases the risk of particle loss, deformation, or unintended contamination. |
| Reproducibility | Stable environmental conditions and controlled manipulation improve workflow repeatability and reproducibility. | Results are often more dependent on operator technique and environmental variability. |
| Long-Term Sample Preservation | Samples maintain greater chemical and structural stability during storage and analysis preparation. | Prolonged atmospheric exposure can reduce long-term sample stability and integrity. |
Applications of Targeted Micro-Sampling Inside Glove Boxes
Targeted micro-sampling inside glove boxes is widely used across several applications as follows:
- Battery Research and Energy Storage: Targeted micro-sampling plays an important role in lithium-ion and solid-state battery research, where many materials are highly sensitive to oxygen and moisture exposure. Researchers use these workflows for electrode particle characterization, solid electrolyte analysis, contaminant isolation, and battery failure mechanism investigations.
- Semiconductor and Microelectronics Analysis: In semiconductor manufacturing and microelectronics research, precision particle isolation is critical for contamination analysis and defect characterization. Targeted micro-sampling supports particulate contamination analysis, defect isolation, foreign material identification, and surface residue characterization.
- Nanotechnology and Advanced Materials Research: Micro-sampling systems are widely utilized in nanotechnology applications involving ultra-fine particles and structurally sensitive materials. Researchers commonly use these workflows for nanoparticle isolation, carbon nanotube characterization, graphene studies, and catalyst particle analysis.
- Pharmaceutical and Chemical Research: In pharmaceutical and chemical laboratories, targeted micro-sampling supports-controlled handling of reactive or contamination-sensitive compounds. Micro-sampling inside glove boxes support reactive compound isolation, particle contamination analysis, crystalline material characterization, and contamination-controlled transfer procedures.
- Failure Analysis and Quality Control: Researchers and manufacturing teams use micro-sampling systems for root-cause investigations, manufacturing contamination studies, defect characterization, and process validation analysis. Accurate isolation of microscopic contaminants or failure-related particles improves diagnostic accuracy and supports more reliable quality control processes.
Precision Micro-Sampling Solutions for Controlled Environments
When a single microscopic particle can determine the outcome of an investigation, compromise is not an option. Barnett Technical Services provides precision micromanipulation and microscopy integration systems designed for glove box workflows, enabling stable positioning, controlled particle handling, and seamless transfer to analytical instruments like Raman and FTIR systems. Whether supporting battery research, semiconductor analysis, nanomaterials characterization, or reactive material investigations, these solutions help laboratories improve analytical confidence, reduce contamination risks, and achieve reliable, repeatable results. Contact Barnett Technical Services to explore solutions tailored to your analytical workflow requirements.