Barnett Technical Services (BTS) is pleased to announce our participation in the 66th Annual Microscopy & Microanalysis Conference (M&M 26), taking place August 2–6, 2026, in Milwaukee, Wisconsin. Join us at Booth 1111 to explore advanced solutions for microscopy, micro-sample handling, and materials characterization.
The M&M Annual Conference is one of the premier global gatherings for researchers, innovators, and industry professionals in microscopy, microanalysis, and materials science. It provides an unparalleled platform to exchange insights, discover breakthroughs, and experience cutting-edge technologies shaping the future of research and industry.
Explore Our Product Lineup
We’ll be showcasing advanced tools designed to advance your microscopy research capabilities:
MicroSupport Micromanipulators
Master precision micro-scale positioning and sample handling with MicroSupport’s advanced micromanipulator systems. These benchtop units feature motorized XYZ stages and a wide range of customizable arms and probes, making them ideal for micro-sampling, electrical probing, liquid deposition, tissue analysis, and in-situ microscopy experiments. These systems are ideal for particle isolation and ex situ lift-out.
MicroSupport D-MARK Sample Marking Systems
Microsupport offers the D-MARK system to mark areas of a sample – this facilitates locating a region of interest that is visible under normal conditions but cannot be observed by SEM. A range of scribing tool orientations and patterns are available.
SOL Instruments Raman Microscopes
SOL manufactures a range of Raman microscopes from systems for routine analysis all the way up to the most advanced research-grade system available on the market.
About the M&M Annual Conference
The M&M Annual Conference is one of the most important interdisciplinary events in microscopy and materials science. Hosted in Milwaukee, it brings together researchers, industry leaders, and innovators from around the world for a week of cross-disciplinary collaboration and scientific exchange.
Participants will have the opportunity to attend technical sessions, symposia, and networking events gaining insights from world-renowned experts and exploring technologies that are shaping the future of microscopy and microanalysis. Whether your focus is electron microscopy, light microscopy, scanning probe techniques, or analytical microanalysis, M&M 26 offers resources and connections to advance your research.
Visit Us at Booth 1111
Don’t miss the chance to connect with the Barnett Technical Services team. Experience live demonstrations of MicroSupport benchtop micromanipulators and discover how this precision solution can advance your microscopy and microanalysis research. Learn how our complete portfolio of partner brands can enhance your laboratory capabilities.
Miniaturization has become the engineering standard for a wide range of circuitry applications. Across microelectronics, advanced sensors, medical devices, and laboratory-scale systems, components continue to shrink while performance demands grow increasingly complex. As systems become smaller and more precise, one challenge becomes critical: how do you create reliable connections using ultra-fine metal wires in the 30–100μm range?
At this scale, precision is non-negotiable. Even minor process variations can compromise performance. Excessive heat may deform or weaken the wire, while insufficient energy can produce unstable joints with poor electrical continuity. Conventional joining methods such as soldering often fall short in these applications, introducing unnecessary thermal exposure, flux contamination, and limited process control.
This is where micro spot welding delivers a distinct advantage. Designed for highly localized energy control, the process enables precise wiring connection and modification for delicate fine-wire assemblies without compromising structural or electrical integrity. For engineers, researchers, and manufacturers working with ultra-fine metal wire, micro spot welding provides a reliable solution for creating durable, repeatable, and high-performance interconnections in advanced applications.
Challenges in Welding Fine Metal Wires
Working with ultra-thin metal wire leaves minimal room for error. Even before welding begins, handling itself becomes a technical task. Alignment must be exact, stability is critical, and the actual joining process introduces further challenges.
Several challenges define this space, including:
Mechanical fragility: Wires in the 30–100μm range are highly susceptible to bending, deformation, or fracture under minimal mechanical stress. Any misalignment during welding can lead to immediate failure.
Thermal sensitivity: These wires react quickly to heat. Even slight variations in welding current or energy input can cause localized melting, thinning, or microstructural distortion.
Inconsistent joint formation: Without precise control, welds may vary in strength, leading to unreliable electrical connections.
Damage to surrounding components: In dense assemblies, heat spread can affect nearby materials, especially in sensitive research setups or microelectronic systems.
Repeatability concerns: In both laboratory and production environments, process consistency is essential. A joining method that cannot consistently reproduce stable weld quality is unsuitable for high-precision applications.
What is Micro Spot Welding?
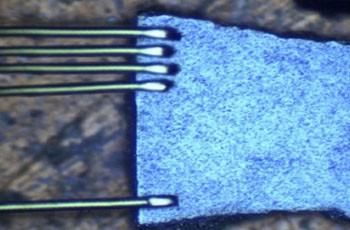
Figure1. Microscope-level view of fine metal wire welding at 30µm scale.
Image Credit: https://www.microsupport.co.jp/
Micro spot welding is a resistance-based joining process that uses precisely controlled electrical pulses to create a bond between conductive materials. Unlike conventional methods, the energy is delivered in very short bursts, typically in the millisecond range.
The process generates heat only at the precise contact point between the electrodes and the wire. This highly localized heating forms a metallurgical bond while minimizing thermal exposure to the surrounding material and adjacent components.
That controlled energy delivery makes it suitable for:
Joining ultra-fine metal wire
Performing delicate wiring connection and modification tasks
Working in confined or sensitive environments
Repairing broken connections
Extending wiring paths
Creating stable junctions
modifying existing configurations.
A key advantage of micro spot welding is process consistency. When properly controlled, the welds are clean, repeatable, and mechanically as well as electrically stable. This level of reliability is particularly important when working with high-value components, precision assemblies, or experimental systems involving fine wire applications.
Micro Spot-Welding Process: How It Works
The micro spot-welding process is conceptually simple, but successful outcomes depend on precise control at every stage. Each step must be carefully executed to ensure a stable and reliable joint.
Following is a step-by-step workflow:
Positioning the Wires: Ultra-fine metal wires are aligned using micromanipulators or precision fixtures. Accurate positioning is critical to ensure proper contact at the intended weld location.
Electrode Placement: Electrodes are positioned at the weld point with controlled contact. The placement must be stable and consistent, without causing deformation or displacement of the wire.
Controlled Current Application: A predefined electrical pulse is applied through the electrodes. The pulse duration is in the millisecond range and is carefully set based on the wire material and diameter.
Localized Heat Generation: Electrical resistance at the contact point generates localized heat. This heat is confined to a small area, minimizing thermal impact on surrounding regions.
Metallurgical Bond Formation: The localized heat causes the materials to fuse, forming a solid metallurgical bond. This completes the wiring connection and modification with high structural and electrical integrity.
The defining characteristic of this process is precision control. Parameters such as output voltage and pulse duration must be optimized according to the specific wire material, diameter, and application requirements. Once established, these parameters enable consistent and repeatable weld quality, making the process highly suitable for both research applications and controlled production environments.
System Capabilities for Micro Welding Applications
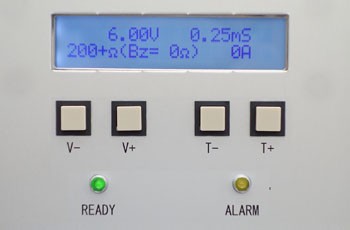
Figure2.Control panel displaying output voltage, pulse time, and real-time resistance and current values.
Image Credit: https://www.microsupport.co.jp/
Effective micro spot welding depends heavily on the capabilities of the system being used. Key system capabilities include:
Output Voltage Control: Precise control of output voltage allows accurate adjustment of energy input. This is essential when working with ultra-fine metal wires in the 30–100μm range, where small changes can impact joint integrity.
Adjustable Pulse Duration: The ability to control pulse generation time enables the system to accommodate different wire materials and diameters. Fine-tuning the pulse ensures sufficient bonding without excessive heat exposure.
Capacitor-Based Energy Storage: A high-capacity capacitor stores and delivers energy for pulse current output. This ensures stable, consistent energy release with each weld, minimizing variability between operations.
Stable Energy Delivery: Consistent energy output across repeated welds is critical for maintaining uniform quality. Stable delivery reduces the risk of weak or inconsistent joints.
Post-Weld Resistance and Current Verification: Resistance and current values are displayed after welding to allow direct confirmation of connection status. This built-in verification step supports quality assurance without additional instrumentation.
Integration with Precision Positioning Systems: Compatibility with micromanipulators improves alignment accuracy and is essential for maintaining consistent contact at the weld point.
Key Beneficial Features of Micro Spot-Welding Systems
Advanced Parameter Control: Micro spot-welding systems provide precise control over output voltage and pulse generation time. This level of precision is essential for achieving reliable welds in fine metal wire, where even slight variations can impact joint quality.
Minimal Heat-Affected Zone (HAZ): The welding process generates highly localized heat at the contact point. This minimizes thermal impact on surrounding areas, preserving the structural integrity of adjacent wire segments and sensitive components.
Clean Welding with Reduced Dust and Spatter: Unlike traditional methods, micro spot welding does not require flux or filler material. The process produces clean, low-spatter welds, which is especially important in high-precision and sensitive environments such as semiconductor labs and research setups.
Capability for Ultra-Fine Metal Wire (30–100μm): These systems are designed to handle ultra-thin metal wire with stability and control. The system delivers optimized energy for strong, consistent joints without damaging the wire.
High Repeatability for Wiring Applications: Once welding parameters are established, the process delivers consistent results across multiple operations. This repeatability is critical for precision wiring connection and modification tasks in both laboratory and production environments.
Millisecond-Level Pulse Control: Millisecond-level pulse regulation enables highly controlled energy delivery, ensuring effective fusion of fine metal wire without excessive thermal exposure. This is essential for maintaining weld quality at micro scale.
Low Mechanical and Thermal Stress: Localized heating reduces stress on ultra-fine metal wire, minimizing the risk of deformation or breakage during welding.
Micro Spot-Welding vs Traditional Soldering for Fine Wires
For ultra-fine metal wire in the 30–100μm range, the differences between these two joining methods become significant.
Parameter
Micro Spot Welding
Traditional Soldering
Heat Impact
Highly localized at the weld point
Heat spreads to surrounding areas
Thermal Control
Precise, controlled energy input
Limited control, higher risk of overheating
Precision
Very high, suitable for micro-scale applications
Limited precision at micro-scale
Suitability for 30–100μm Wires
Excellent, designed for ultra-fine metal wire
Often unreliable for very fine wires
Joint Formation
Direct metallurgical bond between materials
Relies on melted solder as an intermediate layer
Joint Cleanliness
No flux or filler required, clean process
Flux required, residue may remain
Mechanical Strength
Strong and stable joint
Dependent on solder quality and application
Electrical Conductivity
High, due to direct metal-to-metal bonding
Can vary depending on solder and contact quality
Process Consistency
High repeatability once parameters are set
Greater variability between operations
Post-Processing Requirements
Minimal or none
Often requires cleaning to remove flux residue
Industries and Application Use Cases
Semiconductor Failure Analysis and Circuit Repair: The welding process is used to repair, modify, or reconfigure micro-scale circuits during failure analysis. It enables precise reconnection of fine conductors without affecting adjacent structures.
Microelectronics and PCB Modification: In compact electronic assemblies, it supports reliable connections using ultra-fine metal wire. This is particularly useful for prototype development, rework, and design modifications.
Research and Laboratory Instrumentation: Laboratories use micro spot welding for wiring sensors, probes, and experimental setups. The process ensures stable electrical connections while maintaining the integrity of delicate components.
Energy Systems and Battery Development: Fine wire connections are often required in battery research and energy storage systems. The welding process provides consistent joints that support reliable performance and testing accuracy.
Medical Device and Micro-Component Assembly: In medical applications, where precision is critical, micro spot welding enables secure connections in miniature assemblies while minimizing thermal and mechanical impact.
Instrumentation for Micro Spot-Welding Applications
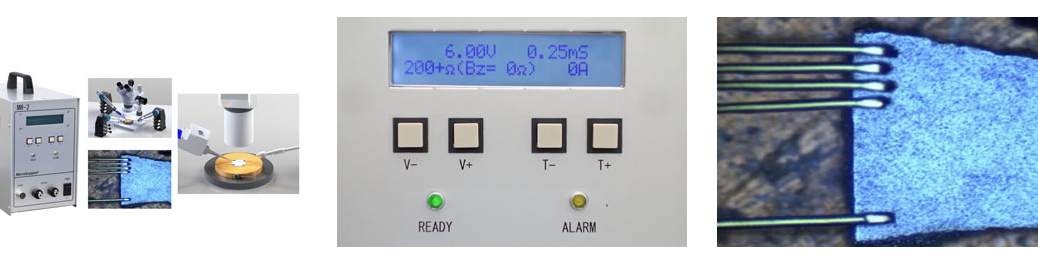
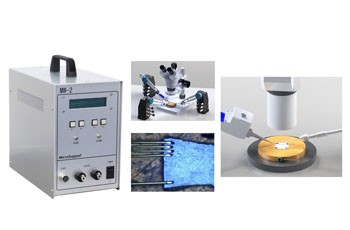
Figure3. Micro-spotwelder unit with integrated micromanipulator setup.
Image Credit: https://www.microsupport.co.jp/
At the scale of fine metal wire, even small variations in alignment or energy delivery can affect joint quality. A stable, well-integrated setup ensures consistent wiring connection and modification with repeatable results.
A typical configuration includes:
Micro Spot-Welding Power Source: Delivers precisely controlled electrical pulses with defined output voltage and pulse duration. A high-capacity capacitor provides stable energy storage and release, essential for forming consistent joints without overheating fine metal wire.
Micromanipulators: Used for accurate positioning of ultra-fine wires at the weld point. Precise alignment is critical before pulse application. Combining the power source with a micromanipulator maximizes positioning accuracy and weld consistency.
Electrodes and Fixtures: Provide stable contact and ensure consistent energy transfer during welding. Proper fixture design helps maintain repeatability across multiple welds.
Optical Observation Systems: Microscopes or imaging systems assist in aligning fine wire structures and monitoring the weld zone during operation.
When properly integrated, these components improve process stability, reduce setup variability, and support consistent results in wiring connection and modification applications.
Precision Starts with the Right Micro Spot-Welding Solution
Precision wiring at the micro scale is demanding. Working with ultra-fine metal wire in the 30–100μm range requires tight control over alignment and energy input. Small variations can easily affect joint quality and reliability.
For applications involving fine metal wire and micro-scale interconnections, selecting the appropriate micro spot-welding system is critical to achieving accurate and repeatable results.
Connect with Barnett Technical Services to explore micro spot-welding solutions, review your application needs, and identify the right setup for accurate, repeatable wiring connection and modification.
Lithium-ion batteries charge fast, discharge under load, and cycle through repeated temperature changes across their lifetime. These temperature changes affect battery performance and safety. To study and analyze the battery’s thermal behavior, it is important to test their specific heat capacity (Cp). It quantifies how much heat a battery needs to absorb before its temperature rises by one degree. This directly shapes the design of thermal management systems and validates safety under fast-charging conditions.
Conventional calorimetric methods can measure specific heat capacity, but they are often time-consuming and difficult to apply to intact battery cells. For battery R&D, EV development, energy storage research, or thermal testing segments, TPS sensor-based, accurate, non-destructive testing (NDT) for effective Cp measurement provides a powerful tool for battery analysis. This post covers how Hot Disk® Hot Cell® sensors enable accurate, non-destructive testing of the specific heat capacity of lithium batteries in real lab environments and on real cells.
Why Specific Heat Capacity is Critical in Lithium Batteries
To know the accurate thermal behavior of batteries, studying only the electrical properties, such as voltage curves, impedance spectra, capacity fade is not enough. Specific heat capacity (Cp) is the amount of heat required to raise the temperature of one kilogram of a material by one degree Celsius (or Kelvin). In a battery, Cp influences how much the cell temperature changes when heat is generated during operation. Here are some pointers.
During fast charging: In this case, current flows in, electrochemical reactions accelerate, and heat builds up internally. Measuring Cp helps determine how much the temperature of the cell can rise for a given amount of generated heat and how the cell accommodates this heat increase.A cell with a higher specific heat capacity has more thermal buffer. It takes longer to reach dangerous temperatures. A cell with a lower Cp reaches that upper limit faster.
From a thermal runaway standpoint: Runaway onset temperatures, heat generation rates, and propagation dynamics all depend on accurate thermal property data. Without reliable Cp values, thermal runaway models and safety simulations rely more heavily on assumptions.
Cooling system: Battery pack designers need Cp data along with other thermal propertiesto correctly size thermal management components.
Operational life: Temperature extremes accelerate degradation in terms of lithium plating, SEI growth, and electrolyte decomposition. Batteries that stay within their thermal operating window generally last longer, and this is where Cp data helps.
Challenges in Testing Specific Heat Capacity of Lithium Batteries
Here are some challenges involved in testing specific heat capacity of lithium batteries using conventional methods.
Measuring Composite Cp Values: Measurements of the specific heat capacity of lithium ion batteries is more complex than this measurement on a standard homogeneous sample because the internal structure of a lithium-ion cell includes laminated stacks of anodes, cathodes, separators, and electrolyte. Each layer has different thermal properties, and the real-world thermal performance depends on their composite behavior. When attempting to characterize the thermal properties of the full cell, capturing this combined behavior can become complex.
Destructive measurement methods: It is challenging for battery engineers to measure intact, commercial-format cells in cylindrical, pouch, or prismatic formats. These cells are sealed, often under internal pressure, and can’t be disassembled without altering their chemistry and therefore, their thermal performance.
Conventional calorimetric methods: Differential scanning calorimetry (DSC) may work well on small, homogeneous samples containing a few milligrams of electrode material, carefully extracted and dried. But the conditions that reflect the real thermal behavior of a full cell under operating conditions are quite different. As a result, DSC measurements typically represent the Cp of individual extracted materials rather than the composite Cp of the entire battery cell. Also, various safety parameters, such as ventilation, charge state management, and temperature controls, are required in a lab setting. This adds to the complexity. Variability in sample preparation, heterogeneous material structure, and thermal contact conditions can sometimes lead to differences in Cp measurements when testing battery materials.
Inconsistent thermal contact between sensor and sample is often the culprit; thankfully, this issue can be solved with the right sensor geometry and measurement protocol.
Hot Disk® Hot Cell® Sensors: Measurement Principle
The Hot Disk® Hot Cell® sensors use the Transient Plane Source (TPS) method, which is described in ISO 22007-2 for thermal conductivity measurements. This approach to thermal property measurement has been refined and validated across decades of materials research. Here’s how they work.
A known, controlled heat pulse is applied through a flat sensor element placed in contact with the sample surface. As heat flows into the material, the sensor simultaneously records the temperature response over time. From that transient response, thermal conductivity and thermal diffusivity are determined, and volumetric heat capacity (ρCp) is derived; specific heat capacity (Cp) can then be calculated when the material density is known.
While Cp is significant, you get a broader thermal property profile from a single measurement. These are useful for building thermal models, where all three parameters are typically required as inputs.
The Hot Cell® Sensor facilitates battery testing due to the cell’s geometry. Standard TPS sensors are flat disks designed to be sandwiched between two identical sample halves. Hot Cell® Sensors are engineered to make reliable, repeatable contact with curved and flat battery surfaces, allowing measurements on intact cells without disassembly or special sample preparation.
Total measurement time is typically a few minutes per test. In this method, the sample remains intact and there is no need to handle or expose the internal electrolyte. Also, the same cell can be tested at multiple states of charge, temperatures, or after cycling, enabling longitudinal characterization studies.
Selecting the Right Hot Cell® Sensor for Your Battery Format
Here are some selection criteria:
Variation across formats: While many commercial batteries follow common form factors (such as cylindrical, pouch, and prismatic cells), dimensions, surface structures, and packaging details still vary across manufacturers. Cells differ in terms of diameters, surface types, and lengths. The sensor you use needs to match the geometry of the cell you’re testing.
Knowing the cell geometry: Selecting the right sensor isn’t complicated once you know your cell geometry. But, knowing it is crucial because a sensor with the wrong contact geometry can create uneven thermal contact and inconsistent contact pressure, which produces inconsistent results.
Hot Cell® Sensors are specifically engineered for battery thermal characterization. Each sensor in the range is designed to ensure proper thermal contact with specific cell formats, which directly affects measurement accuracy and repeatability. The sensor catalog includes options for cylindrical, pouch, and prismatic formats, covering the most common commercial cell sizes used in EV, consumer electronics, and stationary storage applications.
Laboratory Workflow for Testing Specific Heat Capacity of Lithium Batteries Using Hot Cell® Sensors
Thermal property measurement can be complex, and sample preparation alone can take longer than the actual test. With the Hot Disk®Hot Cell® the measurement workflow is straightforward. Here’s a typical workflow for testing specific heat capacity of lithium batteries using Hot Cell® Sensors:
Step 1: Verify battery condition and state-of-charge
Before any measurement, confirm the cell is within its normal operating state-of-charge range and shows no signs of damage or swelling. Document the SOC as it affects thermal properties and is important for result traceability.
Step 2: Select and position the appropriate Hot Cell® Sensor
Match sensor geometry to your cell format. Position the sensor against the cell surface with consistent contact pressure. Most measurements are taken on the outer casing.
Step 3: Configure measurement parameters
Set the heat pulse duration and power level appropriate for your cell size and expected thermal properties. The Hot Disk® software provides guidance on parameter selection.
Step 4: Perform the transient measurement
Run the measurement. The system records the transient temperature response and calculates thermal conductivity and diffusivity, from which specific heat capacity can be determined when material density is known. A typical single measurement takes two to five minutes.
Step 5: Analyze, validate, and document results
Review the derived Cp values along with measured conductivity and diffusivity results. Run at least three repeat measurements per cell to confirm repeatability. Document cell chemistry, format, SOC, and lab temperature alongside results for full traceability.
A few best practices when testing specific heat capacity of lithium batteries:
Maintain stable lab temperature throughout the test sequence as thermal drift introduces noise.
Apply consistent contact pressure between sensor and cell surface for every measurement.
Record battery chemistry and SOC as Cp varies with both, and this information is essential for comparing results across studies.
Conduct repeat measurements on each cell; typically, three or more replicates give you confidence in your reported values.
Applications for Specific Heat Capacity Testing
Here are some applications where accurate Cp data adds real value.
EV battery pack design: When optimizing thermal management systems, engineers use Cp as an input to thermal models to estimate heat storage and temperature rise within the pack. They then use this information to optimize coolant flow rates and validate that the pack stays within safe operating temperatures under worst-case charge and discharge scenarios.
Energy storage systems: Cp data supports both system design and regulatory compliance documentation in large-scale installations where heat buildup across a battery bank can become a serious safety concern.
Fast-charging research: Cp measurement helps understand how battery cells store heat and respond thermally when different cell chemistries and formats are subjected to high currents.
Battery safety validation: This is particularly for cells in aerospace, medical, or grid applications that may require formal thermal property documentation. Cp measurement using a validated, standardized method (ISO 22007-2) provides data that meets audit and certification requirements. Here, Cp helps characterize thermal response and supports models used to assess conditions that may lead to thermal runaway.
Manufacturing quality assurance: Thermal properties can be sensitive indicators of cell consistency. Cp can help verify thermal property consistency between batches and identify deviations from expected material behavior.
Barnett Technical Services offers Hot Disk® Hot Cell® Sensors
Thermal characterization tells you why it behaves the way it does, and whether it’s safe to push further. Hot Disk®Hot Cell® Sensors from Barnett Technical Services provide a practical, accurate, and non-destructive path to evaluating thermal transport properties and determining specific heat capacity (Cp) on intact commercial cells. If you’re building thermal models, validating battery safety, or developing next-generation fast-charging protocols, contact the team at Barnett for the thermal property data you need.
Explore the full range of Hot Disk® Hot Cell® Sensors for your battery format:
Microplastics are pervasive environmental contaminants with known effects on human health. They are found in various natural sources, making their isolation from environmental samples essential – microplastic contamination is now measurable and persistent across water, soil, air, and biological samples.. The challenge in characterization of microplastics lies not only in their small size but also in the diverse composition, shape, color, and surface chemistry. Many particles are weathered, fragmented, or chemically altered. Traditional methods, such as visual sorting under stereo microscopy, are limited by subjectivity and the inability to distinguish plastic from similar-sized particles. Effective detection requires analytical tools offering spatial resolution, chemical specificity, and throughput. Advanced techniques, such as confocal Raman Microscopy, are vital for precise polymer identification at the individual particle level, providing accurate data without assumptions. This post explains how confocal Raman microscopy is used for the accurate characterization and analysis of microplastics, highlighting its capabilities, workflow, and applications in various research areas.
Microplastic Isolation Using MicroSupport Micromanipulators
MicroSupport micromanipulators provide a precise and reliable method for isolating microplastic particles from complex sample matrices. Using fine glass needles under microscopic observation, individual particles can be selectively picked and transferred while minimizing the risk of structural or chemical alteration.
This approach is particularly useful when working with mixed samples containing organic matter, fibers, and other debris, where accurate separation is critical. The controlled manipulation allows researchers to isolate specific particles of interest, reduce contamination, and prepare them for further analysis.
By enabling careful handling and repeatable particle transfer, micromanipulators significantly improve the accuracy and efficiency of downstream techniques such as confocal Raman microscopy.
Understanding the Need for Microplastic Characterization
Microplastics are typically defined as plastic particles smaller than 5 mm. But in practical analysis, the real focus is often much smaller, down to tens of microns or even below. Hence, visual appearance alone is no longer reliable. Two particles may look identical under a microscope yet belong to entirely different polymer classes.
Polymer composition directly influences how a particle behaves in the environment. It affects degradation rate, chemical reactivity, density, and overall environmental impact. Without the polymer composition information, analysis remains surface-level.
A simple particle count can indicate the presence of contamination. But it cannot answer a more important question: what exactly are these particles made of? This is why accurate characterization and analysis of microplastics must go beyond visual inspection and focus on chemical identification.
With precise polymer-level analysis, researchers can:
Confidently differentiate between polymer types, even at the micron-scale resolution
Trace potential sources of contamination across environments and processes
Study degradation pathways and long-term material behavior
Support regulatory reporting with defensible, chemistry-based data
Strengthen environmental assessments with detailed material insights
Analytical Challenges in Microplastic Identification
Several critical factors impact the reliability of microplastic detection and characterization using traditional methods:
Particle Size Limitations: Many microplastics exist at sizes below 50 µm, with a significant portion below 10 µm. Detecting, isolating, and analyzing particles at this scale requires high spatial resolution and precise analytical techniques.
Complex Sample Backgrounds: Environmental and industrial samples often contain a mixture of organic matter, minerals, and biological residues. These background materials can obscure microplastic particles or interfere with analytical signals, complicating identification.
Weathered and Degraded Surfaces: Microplastics found in natural environments are rarely in their original form. Exposure to UV radiation, oxidation, and mechanical abrasion alters their surface chemistry, making it more difficult to match them with standard reference spectra.
Fluorescence Interference: Organic contaminants and certain additives within plastics can fluoresce under laser illumination. This fluorescence can overwhelm or mask the Raman signal, reducing spectral clarity and making accurate identification more difficult.
Requirement for Chemical Specificity: Reliable identification depends on obtaining a clear molecular fingerprint of each particle. Techniques that rely solely on visual or morphological characteristics introduce ambiguity and increase the risk of misclassification. In addition, many particles incorporate additives that impact the toxicity of that particle.
How Confocal Raman Microscopy Enables Microplastic Analysis
Confocal Raman Microscopy addresses the key challenges of microplastics identification at a fundamental level by combining molecular spectroscopy with high-resolution optical imaging.
The technique is based on Raman scattering. When laser light interacts with a material, a small portion of that light is scattered with a shift in energy. This shift corresponds to molecular vibrations within the sample. The result is a unique spectral pattern; essentially a chemical fingerprint of the material.
Each polymer produces a distinct Raman spectrum. This is what enables precise material identification, even when particles are visually indistinguishable. The true strength of this method comes from integrating Raman spectroscopy with confocal optical design, which significantly improves spatial precision and data quality.
In real laboratory conditions, these capabilities translate into clear advantages:
Molecular Identification: Raman spectra provide direct identification of polymer composition without the need for dyes, stains, or chemical labeling. This ensures that analysis remains non-invasive and chemically accurate.
Confocal Spatial Filtering: The confocal optical system isolates signals from a tightly controlled focal volume. This improves spatial resolution and significantly reduces background noise and interference from surrounding materials.
Depth Profiling: Analysis is not restricted to surface-level information. Confocal Raman Microscopy allows researchers to examine subsurface structures and layered compositions within microplastic particles.
Chemical Imaging: Raman mapping enables spatial visualization of different chemical components within a sample. This helps identify particle distribution, mixed materials, and heterogeneous structures.
3D Imaging Capabilities: The system enables three-dimensional analysis by adjusting the focal plane across different depths. This allows detailed study along all three axes (X, Y, and Z), making it particularly useful for heterogeneous materials, irregularly shaped particles, and samples with variable thickness.
Unique Chemical Identification of Materials: In many cases, Raman Microscopy can provide direct and unambiguous identification of pure polymer materials based on their characteristic spectral fingerprints, supporting confident classification.
Minimal or No Sample Preparation: In most applications, samples can be analyzed directly with little or no specialized preparation. This reduces handling time and also lowers the risk of contamination or particle loss.
Non-Destructive Analysis: Raman spectroscopy is fundamentally non-destructive. Samples remain intact after measurement, allowing further analysis using other complementary techniques if required.
Introducing SOL Instruments Confocal Raman Microscopes for Characterization and Analysis of Microplastics
SOL Instruments is a leader in innovation, offering advanced instruments optimized for high-precision research. The confocal Raman microscopes are designed specifically for micro-scale chemical analysis, making them perfect for characterization and analysis of microplastics.
Core capabilities of SOL Raman microscopes include:
High-Resolution Spectral Acquisition: With high-resolution spectral acquisition, the system allows for clear and accurate polymer identification, enabling detailed analysis at the micro-scale.
Advanced Spectral Processing Software: The system comes equipped with sophisticated software for precise interpretation of spectral data, ensuring reliable results for complex analysis.
Automated Particle Mapping: Automated particle mapping allows for the efficient handling of large sample areas, improving throughput and simplifying the analysis process.
Multi-Laser Configurations: Multiple laser configurations reduce fluorescence interference, ensuring that the spectra collected are clean and precise, even for challenging samples.
High Signal-to-Noise Performance: The microscope delivers high signal-to-noise performance, making it capable of detecting even weak Raman signals for more sensitive analysis.
Stable Optical Design: The system features a stable optical design, ensuring consistent and reliable performance over extended periods of use, even in demanding research environments.
Polymer Identification: SOL’s confocal Raman microscopes excel at identifying a wide range of polymers, including:
Polyethylene (PE)
Polypropylene (PP)
Polystyrene (PS)
Polyethylene Terephthalate (PET)
Polyvinyl Chloride (PVC)
Other Specialty Polymers
Reliable Differentiation Between Polymer Types: The system can effectively distinguish between similar polymer types, providing precise identification even for closely related materials.
Chemical Mapping of Individual Microplastics: The system enables in-depth chemical mapping of individual microplastic particles, providing a comprehensive analysis of their composition and structure.
Repeatable and Traceable Measurements: Every measurement made by the system is repeatable and traceable, ensuring consistent and reliable results throughout the analysis process.
Workflow Using SOL Confocal Raman Microscopy
A structured workflow is critical for ensuring reliable and accurate microplastic analysis. Below is a step-by-step breakdown of the workflow for proper characterization and analysis of microplastics.
Step-by-Step Process
Sample Preparation and Particle Isolation: The first step involves isolating microplastic particles from the sample matrix. This is achieved by filtering or separating the sample to extract microplastics, ensuring that only relevant particles are analyzed.
Optical Localization: Using the microscope’s high-resolution optics, researchers visually locate the particles of interest. This step is essential for targeting specific microplastics that may be small or embedded within a larger sample, allowing for precise analysis of each particle.
Raman Spectral Acquisition: Once particles are identified, the microscope uses laser excitation to capture the Raman spectra of each microplastic. This non-destructive process provides valuable information about the chemical composition of the particles, enabling accurate identification.
Spectral Comparison: The acquired Raman spectra are then compared against polymer reference libraries. This allows for the reliable identification of microplastic types by matching the sample’s spectral signature to known polymer profiles, ensuring precise differentiation between various polymer types.
Chemical Mapping and Reporting: After spectral analysis, chemical mapping is performed to create detailed visual representations of the microplastics’ chemical composition.
Quality Assurance Considerations
To ensure the highest standards of data integrity and reliability, the following quality assurance procedures are employed:
Calibration Verification: Before analysis, the system undergoes regular calibration checks to ensure accuracy and consistency across all measurements.
Validation of Spectral Matches: Each spectrum acquired is carefully validated to ensure that the spectral comparison against reference libraries is accurate, minimizing the potential for misidentification.
Repeatability Checks: Multiple measurements of the same particle are conducted to verify the repeatability of results, ensuring that findings are reliable and consistent across different analysis sessions.
Applications of SOL Raman Systems in Microplastic Research
Environmental Monitoring: Detect microplastics in water, soil, and air samples to monitor environmental pollution.
Academic Research: Assist researchers in studying microplastic behavior, distribution, and degradation under various experimental conditions in both laboratory and field environments.
Marine and Freshwater Studies: Track plastic contamination in aquatic ecosystems, providing critical data on the extent of microplastic pollution in oceans, rivers, and lakes.
Wastewater Analysis: Evaluate the efficiency of wastewater treatment processes in removing microplastics. SOL Raman systems enable precise identification and quantification of microplastic content in treated and untreated water samples.
Polymer Degradation Research: Study the aging, weathering, and breakdown of plastic materials in different environments.
Materials Science: Analyze polymers and composite materials to assess their properties, degradation patterns, and interactions with environmental factors, aiding the development of more sustainable materials.
Organic Chemistry and Polymer Chemistry: Investigate the chemical structure of polymers, the types of additives used, and the effects of various degradation processes, providing insights into material composition and breakdown.
Pharmaceuticals and Cosmetology: Ensure the quality of cosmetic products and pharmaceuticals by detecting microplastics, which could pose risks to both human health and the environment.
Forensic Science: Detect and analyze microplastics found at crime scenes or in legal investigations, to trace evidence and understand contamination sources in forensic investigations.
Revolutionize Microplastic Research with SOL Confocal Raman Microscopy
Accurate characterization and analysis of microplastics rely on one crucial factor: reliable chemical identification at small scales. SOL confocal Raman microscopes provide the capability to deliver molecular-level insights without altering the sample, making them perfect for complex environmental and research applications. As the authorized distributor of SOL confocal Raman microscopes, Barnett Technical Services is here to support your research. While this is one of our major offerings, we also offer testing services with accurate reports. Contact our team today to explore the full capabilities of the system, request technical specifications, test your sample, or schedule a personalized demonstration to see the power of SOL technology in action.
Industrial facilities face mounting pressure to track, report, and reduce greenhouse gas emissions. What was once voluntary environmental stewardship has become mandatory compliance in many jurisdictions. Yet achieving accurate, defensible emission data remains challenging for many operations.
GHG emission monitoring has evolved from periodic manual sampling to continuous automated measurement systems that provide the data transparency regulators and stakeholders demand. For facilities in oil and gas, manufacturing, power generation, and chemical processing, understanding modern emission monitoring technologies is no longer optional.
What Is GHG Emission Monitoring?
GHG emission monitoring refers to the systematic measurement and documentation of greenhouse gas releases from industrial sources. Unlike general atmospheric monitoring, emission monitoring focuses specifically on point sources, fugitive emissions, and process-related releases that organizations must quantify for regulatory reporting.
The practice encompasses both continuous emission monitoring systems (CEMS) and portable analyzers for periodic verification, leak detection, and emissions characterization. Modern emission monitoring systems measure methane (CH₄), carbon dioxide (CO₂), and other regulated gases with the accuracy and documentation required for compliance programs.
Regulatory frameworks for greenhouse gas emissions analysis vary significantly across jurisdictions and continue to evolve. Organizations must navigate multiple overlapping requirements depending on their location, industry sector, and emission levels.
In the United States, federal reporting requirements have undergone significant changes. Historically, the Environmental Protection Agency’s Greenhouse Gas Reporting Program established a 25,000 metric ton CO₂ equivalent annual threshold for mandatory facility-level reporting. However, regulatory frameworks continue to evolve at both federal and state levels. Many U.S. states maintain their own emission monitoring requirements independent of federal programs, with California and Washington imposing 10,000 metric ton thresholds and Oregon requiring reporting at 2,500 metric tons for certain sectors. Facilities should verify current reporting obligations with relevant federal, state, and local regulatory agencies.
International standards provide additional frameworks for emission quantification and verification. The ISO 14064 series establishes globally recognized principles for measuring and reporting GHG emissions at both organizational and project levels. These standards prove particularly valuable for multinational corporations seeking consistent measurement methodologies across different jurisdictions and for organizations participating in voluntary carbon markets or sustainability disclosure programs.
The European Union Emissions Trading System imposes comprehensive monitoring, reporting, and verification requirements on covered installations. Under EU ETS regulations, operators must maintain approved monitoring plans, conduct annual emissions measurements using specified methodologies, and obtain third-party verification from accredited verifiers. Verified emission reports must be submitted to competent authorities by March 31st annually, followed by surrender of emission allowances by September 30th. The EU ETS framework includes detailed requirements for measurement uncertainty, calculation methodologies, and data quality management that directly influence technology selection and monitoring program design.
Key regulatory elements include:
Quantification accuracy standards – Specified measurement uncertainties for different emission categories
Reporting frequency – Annual, quarterly, or continuous data submission requirements
Verification protocols – Third-party validation of emission calculations and measurements
Documentation requirements – Detailed records of methodologies, calibrations, and quality assurance
These requirements create operational challenges that drive demand for reliable, automated measurement solutions.
Industries Requiring GHG Emission Monitoring
Several industrial sectors face particularly stringent emission monitoring obligations:
Oil and Gas Facilities: track methane releases from production operations, processing plants, and distribution infrastructure. Fugitive emissions from valve seals, compressor stations, and storage tanks represent significant monitoring challenges requiring portable detection capabilities. These facilities typically employ both continuous monitoring systems and periodic leak detection surveys to characterize total emissions.
Manufacturing Plants: producing cement, steel, chemicals, and other materials generate substantial process emissions from both combustion and industrial processes. These facilities often implement continuous monitoring at major emission points combined with periodic verification of area sources to meet regulatory requirements and identify operational inefficiencies.
Power Generation: facilities burning fossil fuels have historically maintained some of the most comprehensive monitoring programs in industrial sectors. Continuous emission monitoring at stack locations provides the baseline data for emissions trading programs, regulatory compliance verification, and operational optimization.
Waste Management: operations including landfills and wastewater treatment plants characterize methane generation and capture efficiency. These facilities require specialized monitoring approaches for diffuse sources, using both fixed perimeter monitoring systems and portable analyzers for detailed source characterization.
Technologies for Greenhouse Gas Emissions Analysis
Modern emission monitoring relies on advanced spectroscopic methods that provide accuracy, selectivity, and reliability in industrial environments.
Off-Axis Integrated Cavity Output Spectroscopy (OA-ICOS) represents the current benchmark for portable and semi-portable emission monitoring. This laser-based technology achieves exceptional sensitivity and freedom from cross-interference, critical advantages when measuring in complex industrial atmospheres.
Systems utilizing OA-ICOS technology deliver several practical benefits for emission monitoring:
Simultaneous multi-gas measurement without cross-sensitivity
Parts-per-billion detection limits for leak detection applications
Fast response times enabling real-time emission characterization
Traditional NDIR and Electrochemical Sensors continue to serve in some applications, particularly where lower accuracy suffices and cost constraints dominate. However, these technologies generally lack the specificity and long-term stability required for defensible compliance data.
FTIR Spectroscopy provides comprehensive multi-component analysis but typically requires larger, more expensive installations suited to fixed monitoring locations rather than field surveys or verification work.
Implementing an Effective GHG Emission Monitoring Program
Begin by identifying and categorizing all significant emission sources. Continuous point sources require different monitoring approaches than fugitive area sources or intermittent process releases.
2. Measurement Strategy Development
Select appropriate technologies and measurement frequencies for each source category. Major point sources may justify continuous monitoring systems, while periodic surveys with portable analyzers may suffice for minor sources.
3. Quality Assurance Protocols
Establish calibration schedules, data validation procedures, and documentation practices that satisfy regulatory requirements while remaining operationally manageable.
4. Data Management Systems
Implement software infrastructure to collect, validate, and report emission data in required formats. Automated data handling reduces errors and streamlines compliance reporting.
How Advanced Analyzers Improve Emissions Analysis Accuracy
The shift from traditional monitoring methods to advanced spectroscopic systems has transformed emission measurement capabilities. Modern portable analyzers enable measurement approaches that were impractical with earlier technologies.
The GLA131-GGA microportable analyzer exemplifies this evolution. Weighing less than 6 kg, it brings laboratory-grade measurement capability to field applications including leak detection surveys, verification measurements, and emission source characterization. Its fast response time and high sensitivity enable operators to quickly identify emission anomalies and quantify release rates.
For facilities requiring comprehensive multi-gas monitoring, the GLA132-GGA provides simultaneous measurement of CH₄, CO₂, and H₂O with measurement rates up to 1 Hz. This capability supports applications from continuous perimeter monitoring to detailed emission plume characterization. Both systems utilize proven OA-ICOS technology, delivering the measurement quality required for regulatory compliance without the complexity of traditional analytical instruments.
ROI and Cost-Benefit Analysis of GHG Emission Monitoring
While modern emission monitoring systems represent significant capital investments, they deliver measurable returns through multiple channels:
Compliance Cost Reduction – Accurate emission data prevents over-reporting that could trigger unnecessary carbon taxes or emission permit purchases. Under cap-and-trade programs, measurement accuracy directly impacts financial obligations.
Operational Optimization – Continuous monitoring identifies process inefficiencies and equipment malfunctions that waste energy and materials while generating avoidable emissions.
Risk Mitigation – Documented compliance and third-party verification reduce regulatory enforcement risks and potential penalties for reporting violations.
Reputation Management – Transparent emission monitoring supports ESG reporting and demonstrates environmental responsibility to stakeholders, customers, and communities.
For many facilities, improved measurement accuracy and operational insights justify monitoring system investments within 18-24 months.
Standards and Regulatory Confidence
Reliable greenhouse gas emissions analysis requires instruments that meet or exceed regulatory performance specifications while delivering practical operational benefits. Modern spectroscopic analyzers provide the accuracy, stability, and documentation capabilities that compliance programs demand.
Barnett Technical Services takes immense pride in being an Authorized Distributor of ABB-LGR instruments, supporting industrial customers with proven emission monitoring solutions, regulatory expertise, and comprehensive technical support. With the right instrumentation and application knowledge, facilities can confidently meet evolving compliance requirements while optimizing operational efficiency.
3. International Organization for Standardization, “ISO 14064-1:2018 – Greenhouse gases – Part 1: Specification with guidance at the organization level for quantification and reporting of greenhouse gas emissions and removals.” Available at: https://www.iso.org/standard/66453.html
The measurement and tracking of greenhouse gases has become one of the most critical environmental challenges of our time. As global temperatures rise and climate patterns shift, greenhouse gas monitoring provides the essential data needed to understand, quantify, and ultimately mitigate atmospheric changes. Whether you’re a research scientist studying soil emissions, an environmental consultant managing compliance projects, or an academic investigating climate dynamic, accurate GHG monitoring forms the foundation of meaningful environmental work.
Why Greenhouse Gas Monitoring Is Critical
Accurate measurement of atmospheric greenhouse gases has become essential for:
Climate research and atmospheric modeling
Environmental compliance and emissions reporting
Carbon offset verification programs
Agricultural soil flux studies and soil respiration research
Urban air quality management and emissions tracking
Policy development and climate action planning
Wetland and permafrost greenhouse gas emission studies
Materials and ecosystems with different thermal properties interact with greenhouse gases in complex ways. Understanding these interactions and validating emission reduction strategies depends on accurate and repeatable greenhouse gas measurement methods.
What is Greenhouse Gas Monitoring?
Greenhouse gas monitoring is the systematic measurement and analysis of gases that trap heat in Earth’s atmosphere, primarily carbon dioxide (CO₂), methane (CH₄), nitrous oxide (N₂O). These measurements help scientists and organizations track emission sources, evaluate mitigation strategies, and understand the complex interactions between human activity and atmospheric chemistry.
Modern greenhouse gas monitoring has evolved far beyond simple periodic sampling. Today’s advanced systems provide continuous, real-time data with precision measured in parts per billion, enabling researchers to detect subtle changes in atmospheric composition and identify emission sources with unprecedented accuracy.
The Science Behind GHG Monitoring Systems
At the heart of contemporary GHG monitoring lies sophisticated spectroscopic technology. The most advanced systems utilize Off-Axis Integrated Cavity Output Spectroscopy (OA-ICOS), a breakthrough in tunable diode laser absorption spectroscopy that offers exceptional sensitivity and specificity.
Unlike traditional methods that may suffer from cross-interference between gases, OA-ICOS technology achieves molecular-level selectivity. This means instruments can accurately measure target gases even in complex atmospheric mixtures, maintaining precision across varying humidity levels and temperature conditions. The technology works by analyzing how specific wavelengths of laser light interact with gas molecules, creating a unique spectroscopic fingerprint for each compound.
This scientific foundation enables modern analyzers to deliver research-grade accuracy while remaining practical for field deployment, a combination that was impossible with earlier generation instruments.
Technologies Used in Greenhouse Gas Monitoring
Several technological approaches exist for measuring greenhouse gases, each with distinct capabilities:
Laser-Based Analyzers (OA-ICOS Technology)
State-of-the-art accuracy and reliability for research applications
Simultaneous multi-gas measurement with rates up to 1 Hz
Laboratory-quality measurements in portable, field-ready packages
Economical option for basic monitoring applications
Adequate for general air quality assessment
Limited sensitivity for research applications or regulatory compliance
May experience cross-interference in complex atmospheric mixtures
Fourier Transform Infrared Spectroscopy (FTIR)
Broad-spectrum analysis capabilities
Generally requires larger, more expensive equipment
Better suited to laboratory settings than field research
Provides multi-gas detection but with reduced portability
The choice between technologies depends on your specific requirements for portability, measurement precision, response time, and budget considerations.
Key Applications for GHG Monitoring
Soil Flux Measurements
Soil Flux Measurements
Agricultural soils, wetlands, and permafrost regions represent significant sources of greenhouse gas emissions. Measuring these fluxes requires portable equipment capable of rapid deployment in remote locations.
The microportable LGR-ICOS™ GLA131-GGA exemplifies purpose-built solutions for this application:
Weighs less than 6 kg (13 pounds) for single-person deployment
Delivers continuous high-sensitivity measurements of CH₄ and CO₂
Fast response time captures transient emission events
Extensive linear range accommodates both background and elevated concentrations
Battery-powered operation enables measurements without electrical infrastructure
Field researchers appreciate the fast response time that captures transient emission events, such as the methane bursts that occur when permafrost thaws or the CO₂ pulses following soil disturbance.
Climate Research
Long-term atmospheric monitoring stations require instruments that maintain calibration stability over months of continuous operation. For comprehensive climate studies, the LGR-ICOS™ GLA132-GGA provides:
Simultaneous measurement of CH₄, CO₂, and H₂O
Multi-parameter datasets essential for understanding greenhouse gas dynamics
Measurement rates selectable up to 1 Hz reveal atmospheric processes invisible to slower systems
Proven reliability with thousands of systems deployed globally
These systems contribute to critical datasets that inform climate models and policy decisions across diverse environments, from arctic research stations to tropical forest canopies.
Air Quality Assessment
Urban air quality monitoring programs increasingly incorporate greenhouse gas measurements alongside traditional pollutants:
Evaluates effectiveness of transportation and energy policies
Tracks progress toward carbon neutrality goals
Provides data for environmental impact assessments
Supports regulatory compliance reporting
Field Monitoring vs Laboratory Analysis
The choice between field-based and laboratory analysis fundamentally shapes your monitoring program’s design and capabilities.
Portable Field Solutions
Bring measurement capability directly to emission sources
Eliminate sample collection, transport, and storage concerns
Modern portable analyzers set up in minutes
Operate on battery power in locations without electrical infrastructure
Invaluable for transect studies, emergency response, and remote locations
Capture transient events and short-lived atmospheric phenomena
Laboratory-Based Systems
Excel in controlled environments requiring maximum precision
Ideal for high sample throughput
Enable analysis of archived samples
Introduce delays between sampling and results
May miss short-lived emission events or transient phenomena
Selecting the Right GHG Monitoring Equipment
Choosing appropriate instrumentation requires careful consideration of several factors:
Portability Requirements
Will you transport equipment to remote field sites or operate from a fixed location?
Ultra-lightweight analyzers like the GLA131-GGA enable single-person deployment
Larger systems may offer additional capabilities at the cost of mobility
Measurement Speed
Dynamic systems like soil respiration require fast response times
Systems offering 1 Hz measurement rates capture variability slower instruments miss
Consider whether you need to detect rapid transient events
Accuracy Needs
Research applications typically demand higher precision than general surveys
Parts-per-billion sensitivity required for atmospheric background measurements
Parts-per-million may suffice for elevated concentration applications
Environmental Conditions
Will the analyzer face temperature extremes, high humidity, or dusty conditions?
Ruggedized designs maintain performance where standard laboratory instruments fail
Consider operating temperature range and environmental sealing requirements
Multi-Gas Measurement Capability
Single-gas analyzers suitable for focused studies
Multi-gas systems like the GLA132-GGA provide comprehensive datasets from single measurements
Simultaneous measurement improves data consistency and reduces deployment complexity
The LGR-ICOS™ GLA131-GGA, LGR-ICOS™ GLA132-GGA, and LGR-ICOS GLA151-N2OCM utilize proven OA-ICOS technology, eliminating complex calibration procedures while delivering research-grade accuracy across diverse applications.
Best Practices for Accurate Data Collection
Successful greenhouse gas monitoring extends beyond equipment selection to encompass rigorous field protocols:
Minimize Cross-Interference
Modern OA-ICOS-based analyzers virtually eliminate interference from non-target gases
Maintain accuracy even in humid environments where water vapor affects traditional sensors
Verify instrument specifications for cross-interference resistance
Ensure Adequate Equilibration
Allow instruments to stabilize before recording measurements
Particularly critical after significant temperature changes
Important when moving between measurement locations
Document Environmental Conditions
Record temperature, pressure, and humidity alongside gas concentrations
Enable proper data correction and aid interpretation of observed trends
Maintain detailed field notes for quality assurance
Implement Regular Quality Checks
Periodic verification with reference standards confirms continued instrument performance
Ensures data integrity throughout monitoring campaigns
Documents measurement traceability for regulatory compliance
Following these best practices ensures your greenhouse gas monitoring program delivers reliable, defensible data that supports confident environmental decision-making.
Final Thoughts on Greenhouse Gas Monitoring
The measurement and analysis of greenhouse gases represents a critical capability for addressing climate challenges facing our planet. Modern OA-ICOS technology delivers the precision, portability, and reliability required for meaningful environmental research and compliance work across diverse applications from remote soil flux studies to long-term atmospheric monitoring stations.
As environmental regulations evolve and climate research demands grow more sophisticated, reliable measurement techniques become increasingly essential. Barnett Technical Services takes immense pride in being an Authorized Distributor of ABB-LGR instruments, supporting customers with proven greenhouse gas analyzer solutions, application knowledge, and long-term technical support. Together, ABB-LGR technology and BTS expertise provide researchers and environmental professionals with trusted tools for accurate atmospheric measurement.
Ready to implement precise greenhouse gas monitoring for your research or compliance project? Contact Barnett Technical Services to discuss which ABB-LGR analyzer configuration meets your specific requirements. Our application specialists provide consultation, installation support, and ongoing technical assistance.
Advancing materials research and quality control depends on accurate and repeatable thermal measurements. Barnett Technical Services, an Authorized Distributor of Hot Disk® Thermal Analyzers, is excited to highlight a major milestone achieved by our valued partner, Hot Disk®AB.
ASTM E3088-25: A New Global Standard for the Hot Disk® Method
This standard marks a significant achievement for use of the Hot Disk® method and the wider thermophysical measurement community. It establishes an internationally recognized framework for accurately determining thermal conductivity, thermal diffusivity, and specific heat capacity using the transient plane source (TPS) technique.
Why This Matters
The publication of ASTM E3088-25 provides scientists, engineers, and materials researchers with a globally accepted method for measuring thermal transport properties. This is crucial for applications such as:
Material design and thermal management
Process and quality control
Ranking materials by thermal performance
Estimating operating temperature limits
The TPS method’s double-spiral configuration offers several advantages, including:
Minimal sample preparation requirements
Compatibility with a wide range of solid materials
Rapid, repeatable measurements
Capability to measure “at temperature,” avoiding errors caused by averaging across gradients found in steady-state methods
About the Standard
According to ASTM E3088-25:
The method covers materials with thermal conductivity ranging from 0.05 to 500 W/mK and thermal diffusivity from 0.1 mm²/s to 100 mm²/s.
Applicable to homogeneous isotropic and anisotropic solid materials across a temperature range of approximately 200 K to 600 K.
Includes three test methods:
Method A: Isotropic solid bulk specimens
Method B: Anisotropic solids with uniaxial structure
Method C: Isotropic thin slabs with higher thermal conductivity (1–5 W/mK and above)
About Hot Disk® AB
Founded in 1995 in Sweden with roots going back more than 20 years earlier – Hot Disk® AB develops world-leading scientific instruments for measuring thermophysical properties such as thermal conductivity, diffusivity, effusivity, and specific heat capacity.
Their Hot Disk® Thermal Analyzers are recognized as the industry standard for measuring thermal transport properties in research, development, and quality control (QC).
With a diverse portfolio of instruments, Hot Disk® systems offer flexibility through multiple sensor types, measurement modules, and accessories – enabling precise alignment with customer requirements across materials and industries.
Barnett Technical Services: Delivering Hot Disk® Innovation and Expertise to the U.S. Market
As an Authorized Distributor of Hot Disk® instruments, Barnett Technical Services proudly supports researchers, laboratories, and manufacturers across North America with:
Expert consultation and application guidance
Local sales and service support
Training and demonstrations on Hot Disk® systems
We congratulate the Hot Disk® team and the international collaborators who helped make ASTM E3088-25 a reality – a step forward for standardization and innovation in thermal analysis.
Thermal conductivity testing has evolved beyond slow, highly controlled laboratory setups. Today’s laboratories need instruments that can handle diverse materials, deliver results quickly, and integrate smoothly into real-world workflows. A TPS conductivity meter was developed to meet exactly these needs.
Rather than focusing on theoretical heat transfer alone, a TPS conductivity meter is designed as a practical measurement system-combining hardware, sensors, and software to deliver reliable thermal property data with minimal setup.
What Is a TPS Conductivity Meter?
A TPS conductivity meter is a complete thermal analysis instrument used to measure thermal conductivity using the Transient Plane Source principle. Unlike traditional conductivity testers that rely on large fixtures or steady-state conditions, a TPS conductivity meter is built around a compact sensor-based measurement system.
At its core, the instrument includes:
A precision power supply
A high-sensitivity temperature measurement circuit
Interchangeable TPS sensors
Dedicated analysis software
Together, these components allow the instrument to perform controlled transient heating experiments and convert the response into usable thermal conductivity data.
Hot Disk® TPS 2500 S
How a TPS Conductivity Meter Is Different from “Methods”
While TPS is the underlying measurement principle, a TPS conductivity meter is not just a method—it is a fully integrated instrument platform.
Key differences:
The method describes how heat transfer is analyzed
The meter defines how that method is implemented reliably, repeatedly, and safely in a laboratory environment
This distinction matters because measurement accuracy depends as much on instrument stability, sensor design, and software modeling as it does on the physics itself.
Inside a TPS Conductivity Meter: Key Components
1. Measurement Unit
The core electronics control power delivery to the sensor and record minute temperature changes with high resolution. Stability at this level is essential for repeatable results.
2. TPS Sensors
Sensors are thin, flat elements designed to sit in direct contact with the sample. Different sensor sizes and constructions allow testing of:
Small or large samples
Thin or thick materials
Soft, rigid, or fragile specimens
3. Sample Interface
Unlike traditional fixtures, TPS conductivity meters rely on direct contact rather than clamping or machining. This simplifies testing and reduces sample damage.
4. Analysis Software
The software performs transient data fitting, error checking, and property calculation. It also stores measurement conditions for traceability and repeat testing.
How a TPS Conductivity Meter Works in Practice
Instead of long equilibrium-based tests, a TPS conductivity meter follows a controlled transient workflow:
Sensor Placement The sensor is positioned between samples or against a single surface with a known backing material.
Power Application The instrument applies a precisely defined electrical input to the sensor for a short duration.
Thermal Response Capture The sensor records how its temperature changes as heat flows into the material.
Model-Based Evaluation The software compares the recorded response to theoretical models to determine thermal conductivity.
This entire process is designed to minimize operator intervention while maintaining measurement reliability.
Why Laboratories Choose TPS Conductivity Meters
Laboratories adopt TPS conductivity meters not only for accuracy, but for operational efficiency.
Key practical benefits include:
Short test times that support high sample throughput
Minimal sample preparation
Reduced dependency on sample geometry
Non-destructive testing for valuable or limited samples
These advantages make TPS conductivity meters especially attractive for R&D labs working with frequently changing materials.
Materials Commonly Tested with TPS Conductivity Meters
Because the instrument is sensor-based and geometry-flexible, it can be used for:
Polymers and elastomers
Composites and laminates
Battery materials and cells
Thermal interface materials
Foams and insulation
Liquids, gels, and powders
The same instrument platform can often be used across multiple projects without reconfiguration.
Role of TPS Conductivity Meters in Quality Control
Beyond research, TPS conductivity meters are increasingly used in production and quality control environments.
They support:
Incoming material verification
Batch-to-batch consistency checks
Failure analysis
Process optimization
Fast measurements allow thermal conductivity to become a routine quality parameter, rather than a specialized lab-only test.
Standards and Measurement Confidence
A TPS conductivity meter bridges the gap between advanced thermal theory and everyday laboratory needs. By combining controlled power delivery, sensitive temperature detection, and robust software analysis, it enables fast and reliable thermal conductivity testing across a wide range of materials.
Barnett Technical Services takes immense pride in being an Authorized Distributor of Hot Disk® instruments, supporting customers with proven TPS conductivity meter solutions, application knowledge, and long-term technical support. With the right instrumentation and expertise, laboratories can confidently address today’s evolving thermal measurement challenges.
As materials become more advanced and application demands grow more complex, accurately measuring thermal properties has become increasingly critical. The Transient Plane Source (TPS) method has emerged as a reliable, fast, and highly adaptable solution for thermal conductivity testing and related thermal property measurements across a wide range of materials.
Originally developed to overcome the limitations of traditional steady-state techniques, TPS is now an internationally recognized method, widely used in research, development, and quality control laboratories.
Why Thermal Conductivity Measurement Is Critical
Thermal conductivity describes how efficiently heat moves through a material when exposed to a temperature difference. This property directly impacts performance, safety, and reliability in applications such as:
Electronic device cooling
Battery thermal management
Aerospace and automotive components
Insulation and building materials
Advanced polymers and composites
Materials with high thermal conductivity are essential for efficient heat dissipation, while low-conductivity materials are required for effective thermal insulation. Selecting the right material—and validating its properties – depends on accurate and repeatable thermal conductivity measurement methods.
Heat transfer behavior cannot be fully described by thermal conductivity alone. TPS thermal conductivity testing enables evaluation of additional properties that influence real-world performance:
Thermal Diffusivity – how quickly heat spreads through a material
Volumetric Heat Capacity – how much heat a material can store per unit volume
Thermal Effusivity – how readily a material exchanges heat with its surroundings
Anisotropy – Differences in the thermal properties of a solid material in different directions
Together, these properties provide a comprehensive understanding of thermal behavior under dynamic operating conditions.
Limitations of Traditional Thermal Conductivity Testing Methods
Before TPS, laboratories primarily relied on steady-state and early transient techniques such as:
Guarded hot plate
Heat flow meter
Laser flash analysis
While effective in specific scenarios, these methods often present challenges:
Long test durations
Strict sample size and geometry requirements
Difficulty measuring low-conductivity or anisotropic materials
Limited suitability for layered or inhomogeneous samples
As materials became more complex- particularly polymers, composites, and battery components- the need for a faster and more flexible testing method became increasingly clear.
The Transient Plane Source (TPS) method is a non-destructive, transient thermal measurement technique that uses a flat, double-spiral sensor acting simultaneously as a heat source and a temperature sensor.
Measurement Process:
The sensor is placed between two sample surfaces or on a single surface with a known backing material
A controlled electrical current is applied to the sensor
The resulting temperature rise is recorded as a function of time
Thermal conductivity and thermal diffusivity are calculated from the transient temperature response
This approach enables multiple thermal properties to be determined from a single, short measurement, without requiring steady-state conditions.
How TPS Thermal Conductivity Testing Works
During a TPS measurement:
A known electrical power is applied for a defined time interval
The sensor continuously records temperature change
Mathematical models analyze the transient response to determine thermal properties
Because TPS does not require prolonged thermal equilibrium, measurements can be completed in seconds to minutes-significantly improving laboratory efficiency while maintaining high accuracy.
Sensor Design and Measurement Configurations
TPS sensors are constructed as double-spiral conductive elements embedded within electrically insulating layers. This design provides:
Uniform heat distribution
High sensitivity to temperature changes
Reduced influence from sample size limitations
Depending on the material, measurements can be performed using:
Symmetric testing – sensor placed between two identical samples
Asymmetric testing – sensor placed on one surface with a backing material
This flexibility allows TPS to measure bulk solids, thin samples, liquids, powders, and soft materials using the same fundamental technique.
Advantages of TPS Over Conventional Thermal Conductivity Methods
1. Rapid Measurements Without Steady-State Conditions
TPS eliminates the need for thermal equilibrium, enabling fast measurements that dramatically improve lab productivity.
2. Minimal Sample Preparation
A wide range of sample sizes, thicknesses, and surface conditions can be tested with minimal preparation.
3. Broad Material Compatibility
TPS can measure:
Solids, liquids, and powders
Polymers, ceramics, metals, and composites
Low- and high-conductivity materials
This versatility makes TPS particularly valuable for R&D environments working with diverse material systems.
4. Accurate Testing of Anisotropic and Inhomogeneous Materials
TPS supports directional thermal conductivity measurement, making it ideal for:
Layered composites
Fiber-reinforced materials
Battery electrodes and separators
5. Simultaneous Measurement of Multiple Properties
Thermal conductivity, thermal diffusivity, and volumetric heat capacity can be obtained from a single experiment, improving data consistency and reducing test time.
TPS for Anisotropic and Advanced Materials
Many modern materials exhibit anisotropy, meaning thermal conductivity varies by direction. TPS enables directional measurements by controlling sensor orientation and test configuration, providing data that is essential for thermal modeling and system-level design.
Why TPS Is Widely Adopted Across Industries
Electronics & Thermal Management: TPS enables rapid evaluation of thermal interface materials, substrates, and heat-spreading components critical for device reliability.
Energy Storage & Battery Research: Accurate thermal characterization supports improved battery performance, safety, and lifespan without destructive testing.
Aerospace & Automotive: Lightweight composites and advanced alloys require precise and repeatable thermal data across complex material structures.
Construction & Insulation: Low-conductivity materials such as foams and insulation benefit from TPS’s sensitivity and repeatability.
TPS as an Internationally Recognized Method
The Transient Plane Source (TPS) method is internationally recognized and formally standardized for thermal transport property measurement. It is defined under ISO 22007-2 for the determination of thermal conductivity and thermal diffusivity, and under ISO 22007-7 for the direct measurement of thermal effusivity using a plane heat source technique.
In addition to ISO standardization, the TPS method has received further validation through ASTM E3088-25, which specifies test methods for measuring thermal conductivity and thermal diffusivity of solid materials using a double-spiral configuration of the transient plane source method. This ASTM standard expands the applicability of TPS testing beyond plastics to a broad range of isotropic and anisotropic solid materials.
Together, these international standards confirm the TPS method’s accuracy, repeatability, and broad applicability – making it a trusted choice in both academic research and industrial laboratories worldwide.
Final Thoughts on TPS Method
The Transient Plane Source (TPS) method represents a major advancement in thermal conductivity testing, combining speed, accuracy, and versatility in a single, non-destructive measurement technique. Its ability to evaluate multiple thermal properties across a wide range of materials makes TPS an essential tool for modern research, product development, and quality control laboratories.
As material systems continue to evolve and thermal management challenges become more demanding, reliable measurement techniques are critical. Barnett Technical Services takes immense pride in being an Authorized Distributor of Hot Disk® instruments, supporting laboratories with proven TPS technology, application expertise, and trusted technical guidance. Together, TPS methodology and Hot Disk® instrumentation provide a future-ready solution for accurate and dependable thermal analysis.
Barnett Technical Services (BTS) is excited to announce our participation at SPIE Photonics West 2026, taking place January 20–22, 2026, at the Moscone Center in San Francisco, California. Visit us at Booth 2339 to explore advanced tools for optical analysis, stress measurement, micro-manipulation, and nanoscale materials characterization.
SPIE Photonics West is the world’s largest and most influential event for photonics, optics, and laser technologies – bringing together researchers, engineers, and industry leaders from across academia and high-tech manufacturing. The exhibition offers a unique opportunity to experience emerging technologies, exchange technical insights, and discover solutions driving the future of photonics-enabled innovation.
Explore Our Product Line
At Photonics West 2026, BTS will showcase a specialized portfolio of high-performance instrumentation designed to support optical researchand advanced materials analysis.
Luceo Polariscopes & Optical Components
Luceo’s precision optical tools including polariscopes, polarizers, and waveplates are engineered for high-accuracy polarization analysis and optical inspection. These solutions are ideal for applications such as stress analysis in transparent materials, optical alignment, and research-grade polarization measurements across photonics and materials science environments.
Orihara Surface Stress Meters
Orihara’s surface stress meters provide reliable, non-destructive measurements of Compressive Stress (CS) and Depth of Layer (DOL) for surface-strengthened glass materials.. Widely used in optics manufacturingand materials research, these instruments help ensure product quality, performance, and durability by delivering precise stress characterization.
MicroSupport Benchtop Micromanipulators
MicroSupport’s benchtop micromanipulators offer exceptional control for micro-scale positioning and sample handling. Designed for tasks such as probing, micro-assembly, and precision manipulation, these systems support a wide range of photonics and semiconductor workflows-where stability, repeatability, and accuracy are critical.
Attolight Cathodoluminescence Systems
Attolight’s advanced cathodoluminescence (CL) solutions enable nanoscale optical and electronic characterization within electron microscopy environments, especially for the analysis of compound semiconductor materials. Attolight’s Monch STEM-add-on product facilitates light injection for advanced structural and functional analysis. These systems are ideal for investigating semiconductor materials, defects, and quantum structures – providing high-resolution insight into optical emissions and material properties.
Why Attend SPIE Photonics West?
SPIE Photonics West serves as a global hub for innovation across fields such as:
Photonics and optics
Semiconductors and microelectronics
Quantum technologies
Advanced materials
Optical metrology and imaging
Attendees can participate in technical conferences, product demonstrations, and networking events-gaining firsthand exposure to technologies shaping next-generation research and industrial applications.
Visit Barnett Technical Services at Booth 2339
Stop by Booth 2339 to connect with the Barnett Technical Services team and learn how our specialized instrumentation can support your optical and materials research goals. Whether you’re advancing photonics R&D, improving manufacturing processes, or exploring nanoscale phenomena, BTS delivers solutions that combine precision, performance, and reliability.
We look forward to seeing you in San Francisco at SPIE Photonics West 2026!