
Real-Time Gas Flux Analysis for Capturing Transient Soil Emission events

Soil greenhouse gas emissions rarely occur at steady, predictable rates. Instead, many of the most significant emission events happen as short-lived pulses triggered by environmental changes such as rainfall, freeze-thaw cycles, or management activities. Traditional flux measurement approaches, designed for stable conditions and periodic sampling, often miss these transient phenomena entirely or severely underestimate their magnitude.
Real-time gas flux analysis addresses this critical measurement challenge by providing continuous, high-frequency monitoring capable of capturing emission dynamics that occur on second-to-minute timescales. This capability has transformed understanding of soil-atmosphere gas exchange, revealing that transient events often account for disproportionately large fractions of total emissions despite their brief duration. For researchers quantifying ecosystem carbon budgets, evaluating agricultural management practices, or developing emission inventories, capturing these rapid events is essential for accurate assessment.
Understanding Transient Soil Emission Events
Transient emission events represent rapid, short-duration changes in soil gas flux triggered by specific environmental or management factors. Unlike baseline emissions that vary gradually with seasonal temperature and moisture patterns, transient events produce emission pulses that can exceed background rates by orders of magnitude, then return to baseline levels within minutes to hours.
These events occur when environmental conditions suddenly shift in ways that alter microbial activity, gas transport through soil, or the physical release of accumulated gases. The magnitude and duration of transient events depend on factors including soil moisture status, temperature, gas storage capacity, and the intensity of the triggering mechanism. In many ecosystems, cumulative emissions from infrequent transient events contribute substantially to annual budgets despite representing a small fraction of measurement time. The importance of transient events extends beyond accurate emission quantification. Understanding the mechanisms that trigger these pulses and the factors controlling their magnitude provides insight into soil biogeochemical processes that determines how ecosystems will respond to changing climate and management. This process-level understanding proves essential for developing predictive models and designing mitigation strategies.
Why Traditional Flux Methods Miss Transient Events
Conventional soil flux measurement approaches typically involve chamber enclosures combined with gas chromatography analysis or non-dispersive infrared sensors. In standard protocols, chambers are closed for 20-60 minutes while samples are collected at 10–30-minute intervals. This temporal resolution proves adequate for measuring steady-state fluxes under stable conditions but becomes problematic when emissions change rapidly.
Gas chromatography-based systems require sample collection, transport to analytical instruments, and processing time that introduces delays ranging from minutes to hours between sampling and results. Even when samples are collected at relatively short intervals, the time required for analysis means that emission patterns can only be reconstructed retrospectively. If a transient event occurs between scheduled sampling points or if its duration is shorter than the sampling interval, it may go undetected entirely.
Automated systems using slower infrared sensors improve temporal coverage but still face limitations. Most NDIR sensors require 30-60 seconds for stable readings, effectively limiting measurement frequency to 1–2-minute intervals at best. For emission pulses lasting only seconds to minutes, even this improved resolution may integrate across the event peak, yielding averaged values that underestimate maximum flux rates and potentially missing the event onset entirely.
Eddy covariance systems provide continuous atmospheric flux measurements but integrate over spatial footprints of hundreds to thousands of square meters. While valuable for ecosystem-scale budgets, this approach cannot resolve localized emission hotspots or characterize fine-scale spatial patterns. Small-scale transient events from individual soil patches or management activities may be diluted below detection limits in the integrated signal.
How Real-Time Measurement Captures Rapid Emission Changes
Real-time gas flux analysis employs laser spectroscopy systems capable of measuring gas concentrations at frequencies up to 1 Hz (one measurement per second). This high temporal resolution enables detection and quantification of emission changes occurring over timescales previously inaccessible to soil flux researchers.
The measurement process typically involves chamber enclosures connected to portable analysers via closed-loop tubing. As gases accumulate in the sealed chamber, the analyser continuously measures concentration changes in the headspace. With measurement intervals of one second or less, the resulting concentration time series reveals detailed dynamics including event onset, peak flux rates, and return to baseline conditions. This information enables accurate integration of total emissions even for brief events and supports analysis of the mechanisms controlling emission patterns.
Fast response time proves particularly critical during the initial moments after chamber closure or following a triggering event. Many transient emissions show exponential decay patterns where flux rates change most rapidly in the first minutes. High-frequency measurements capture this dynamic behaviour, enabling non-linear fitting approaches that improve flux calculation accuracy compared to linear regression methods that assume constant emission rates.
The ability to observe concentration changes in real time also supports adaptive sampling strategies. Researchers can identify when transient events occur and adjust measurement protocols accordingly, concentrating sampling effort during high-activity periods while reducing measurement frequency during stable baseline conditions. This optimization improves statistical power for detecting treatment effects and increases overall measurement efficiency.
Rainfall Induced Emission Pulses
Rapid soil wetting following precipitation represents one of the most significant triggers for transient gas emissions. When rain falls on dry soil, several processes combine to produce immediate emission responses. Water displaces gas-filled pore spaces, physically forcing dissolved and free-phase gases into the atmosphere. Simultaneously, moisture addition activates dormant microbial populations and enhances substrate availability, rapidly increasing biological gas production.
Oxygen depletion in saturated microsites shifts metabolic pathways, often favouring anaerobic processes that produce methane and nitrous oxide. These rainfall-induced pulses typically peak within minutes of wetting and decay over subsequent hours as soil conditions stabilize. However, the magnitude can be substantial. Studies measuring N₂O emissions from agricultural soils have documented pulse events exceeding 100 times baseline flux rates, with most of the emission occurring in the first 30-60 minutes following precipitation. Methane emissions from wetland margins and seasonally dry floodplains show similar patterns, with dramatic pulses accompanying the first significant rainfall after dry periods.
For agricultural systems, rainfall timing relative to fertilizer application proves particularly important. When precipitation follows nitrogen fertilization before substantial nitrogen uptake by crops, the combination of high substrate availability and optimal moisture conditions produce extreme N₂O pulses. Capturing these events accurately is essential for developing realistic emission factors and evaluating best management practices designed to minimize agricultural greenhouse gas impacts.
The Fertilizer Connection
Rapid soil wetting following precipitation represents one of the most significant triggers for transient gas emissions. When rain falls on dry soil, several processes combine to produce immediate emission responses. Water displaces gas-filled pore spaces, physically forcing dissolved and free-phase gases into the atmosphere. Simultaneously, moisture addition activates dormant microbial populations and enhances substrate availability, rapidly increasing biological gas production. Oxygen depletion in saturated microsites shifts metabolic pathways, often favouring anaerobic processes that produce methane and nitrous oxide.
These rainfall-induced pulses typically peak within minutes of wetting and decay over subsequent hours as soil conditions stabilize. However, the magnitude can be substantial. Studies measuring N₂O emissions from agricultural soils have documented pulse events exceeding 100 times baseline flux rates, with the majority of emission occurring in the first 30-60 minutes following precipitation. Methane emissions from wetland margins and seasonally dry floodplains show similar patterns, with dramatic pulses accompanying the first significant rainfall after dry periods.
For agricultural systems, rainfall timing relative to fertilizer application proves particularly important. When precipitation follows nitrogen fertilization before substantial nitrogen uptake by crops, the combination of high substrate availability and optimal moisture conditions produces extreme N₂O pulses. Capturing these events accurately is essential for developing realistic emission factors and evaluating best management practices designed to minimize agricultural greenhouse gas impacts.
Freeze-Thaw Cycle Emissions
Soil freezing and thawing represents another critical driver of transient emissions, particularly in high-latitude and alpine ecosystems where permafrost thaw has become a significant climate feedback concern. As frozen soil thaws, multiple mechanisms contribute to rapid gas release. Physical expansion during freezing disrupts soil aggregates and root structures, releasing trapped gases when ice melts. Microbial populations, dormant during frozen conditions, resume activity rapidly as temperatures rise, consuming oxygen and producing CO₂ and CH₄. Cell lysis from freeze damage releases organic substrates that fuel microbial metabolism, temporarily elevating respiration rates.
Spring thaw events in Arctic and boreal regions produce some of the largest documented transient emission pulses, with CO₂ flux rates during thaw periods exceeding summer peak values. These pulses occur during narrow temporal windows, sometimes lasting only hours to days depending on soil temperature dynamics and snow cover patterns. Traditional measurement approaches with periodic sampling visit frequencies measured in days or weeks frequently miss these critical events entirely, leading to systematic underestimation of annual carbon loss from thawing permafrost regions.
Capturing freeze-thaw emissions requires measurement systems capable of operating reliably across wide temperature ranges while maintaining fast response times. The ability to deploy equipment rapidly when thaw conditions occur, measure continuously through the event, and capture the complete emission pulse from onset through return to baseline provides data essential for understanding permafrost carbon dynamics and improving climate model projections.
Irrigation Event Response
In managed agricultural systems, irrigation represents a controlled wetting event analogous to natural precipitation but with timing and intensity determined by management decisions. Understanding emission responses to irrigation proves important both for developing accurate greenhouse gas inventories and for optimizing water management to minimize environmental impacts.
Irrigation-induced emission pulses typically follow patterns similar to rainfall events but with some important distinctions. The uniform application rates and predictable timing of irrigation allow for planned measurement campaigns that capture events more consistently than opportunistic rainfall sampling. Different irrigation methods produce varying wetting patterns and emission responses. Flood irrigation creates strong but spatially variable pulses. Drip irrigation produces more localized, sustained emissions. Centre-pivot systems generate emission gradients across fields as the irrigation apparatus passes.
The magnitude of irrigation-induced pulses depends on soil moisture status before application, application rate and duration, and the time since last fertilization. Measurements capturing these emission dynamics help optimize irrigation scheduling to balance crop water needs against greenhouse gas production. For example, frequent small irrigation applications may reduce total emissions compared to less frequent heavy applications that create extended anaerobic conditions, even when total water applied remains constant.
Diurnal Temperature-Driven Variations
Soil temperature exerts strong control over microbial metabolism and gas diffusion rates, producing systematic diurnal emission patterns in most ecosystems. While not as dramatic as precipitation or freeze-thaw pulses, these daily cycles represent persistent sources of temporal variability that require adequate sampling frequency for accurate quantification.
Respiration typically increases exponentially with temperature following well-established Q₁₀ relationships. In many soils, morning warming produces measurable increases in CO₂ flux within minutes as temperature rises. Peak emissions occur during afternoon maximum temperatures, followed by declining rates through evening and night. The magnitude of diurnal variation depends on factors including soil moisture, vegetation cover, and the temperature sensitivity of local microbial communities.
Capturing diurnal patterns accurately requires either continuous measurement or sampling protocols that account for time-of-day effects. Measurements taken only during mid-morning or afternoon hours may not represent true daily average fluxes. High-frequency monitoring reveals not just average diurnal patterns but also day-to-day variations in amplitude and timing that relate to other environmental factors such as soil moisture stress or recent precipitation. This information improves understanding of controls on soil respiration and reduces uncertainty in annual emission estimates.
Fertilizer Application Response
Nitrogen fertilizer application to agricultural soils triggers one of the most significant and economically important categories of transient N₂O emissions. The magnitude and timing of post-application emission pulses directly influence the efficiency of nitrogen fertilization and the environmental footprint of crop production.
Immediately following fertilizer application, soil nitrate and ammonium concentrations increase dramatically. This substrate pulse, combined with physical soil disturbance during application, produces rapid N₂O emission responses. Peak flux often occurs within hours to days of application, with emission rates declining as microbes consume available nitrogen and crops begin uptake. The fraction of applied nitrogen lost as N₂O during these pulse events typically ranges from less than 1% to over 5%, depending on soil conditions, fertilizer type, application method, and environmental factors.
Capturing the complete emission response curve following fertilization requires continuous or very frequent measurement beginning immediately after application and continuing until fluxes return to background levels. Single measurements days or weeks after application miss peak emission periods and provide insufficient data for calculating emission factors. Real-time measurement enables researchers to quantify total event emissions, identify peak timing, and relate emission patterns to soil environmental conditions, ultimately supporting development of practices that maintain crop productivity while minimizing greenhouse gas losses.
ABB LGR-ICOS Technology for High-Frequency Flux Measurement
The ABB LGR-ICOS™ GLA132-GGA analyser provides the measurement capabilities required for capturing transient soil emission events. This system delivers simultaneous measurement of methane (CH₄), carbon dioxide (CO₂), and water vapor (H₂O) at rates selectable up to 1 Hz, providing the temporal resolution needed to resolve rapid concentration changes during dynamic emission events.
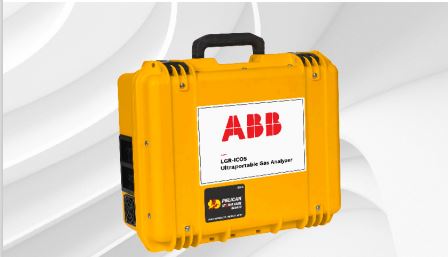
Off-Axis Integrated Cavity Output Spectroscopy (OA-ICOS) technology achieves parts-per-billion sensitivity while maintaining the fast response time essential for transient event capture. The optical cavity design extends effective path length to thousands of meters within a compact instrument, dramatically improving sensitivity compared to conventional absorption spectroscopy without sacrificing measurement speed. This combination of high sensitivity and fast response enables detection of subtle concentration changes during low-flux baseline periods while accurately quantifying elevated concentrations during emission pulses.
The ruggedized field-portable design allows deployment to remote locations and operation under variable environmental conditions. Battery power and compact dimensions support rapid mobilization when transient events are forecasted or detected, enabling measurement campaigns timed to capture specific phenomena such as spring thaw or post-rainfall pulses. Temperature-stable performance maintains measurement accuracy across the wide ambient temperature ranges encountered during field research, from arctic environments to tropical agricultural systems.
For applications requiring long-duration monitoring to capture infrequent or unpredictable transient events, the LGR-ICOS™ GLA131-GGA offers similar high-frequency measurement capabilities for CH₄ and CO₂ in an ultra-lightweight package weighing less than 6 kg. This portability proves particularly valuable for research programs involving multiple measurement locations or situations where equipment must be transported significant distances from vehicle access points.
The LGR-ICOS™ GLA151-N2OCM provides specialized capabilities for nitrous oxide research, measuring N₂O, CO, and H₂O concentrations at rates up to 1 Hz with response times under 8 seconds. This fast-response capability makes it well-suited for capturing fertilizer-induced N₂O pulses and other rapid agricultural emission events. At 23 kg, it is designed as a portable field analyser that can be transported to remote sites while maintaining the measurement speed necessary for transient event characterization.
Deployment Strategies for Transient Event Studies
Successful transient event characterization requires thoughtful experimental design that balances measurement frequency, spatial coverage, and logistical constraints. Automated chamber systems connected to real-time analysers enable unattended monitoring programs that capture events regardless of when they occur. Programmable controllers open and close chambers on defined schedules, with measurement frequency adjusted based on research objectives and expected event dynamics.
For studies targeting specific triggered events such as rainfall or irrigation, event-responsive protocols optimize measurement effort. Baseline measurements at lower frequency establish pre-event conditions and quantify background fluxes. When triggering conditions are detected, either through automated sensors or manual observation, measurement frequency increases to capture the complete emission response. Systems equipped with remote data access allow researchers to monitor conditions and adjust protocols without site visits, improving capture probability for unpredictable events.
Data management becomes increasingly important as measurement frequency increases. A single chamber measured at 1 Hz accumulates 3,600 data points per hour. Multiplying across multiple chambers and extended monitoring periods generates large datasets requiring robust storage, quality control, and analysis workflows. Modern analysers typically include onboard data logging and integration with field computers or cloud-based platforms that facilitate real-time data review and automated quality checks.
Chamber design considerations for transient event studies differ somewhat from steady-state flux protocols. Chambers must achieve rapid pressure equilibration during closure to avoid artifacts. Mixing fans ensure representative headspace sampling. Chamber volume and soil area are selected to balance adequate concentration buildup rate against maintaining near-ambient conditions during measurement. For very high flux events, larger chamber volumes or shorter measurement periods prevent excessive CO₂ accumulation that might suppress respiration or alter chamber temperature.
Data Analysis Approaches for Dynamic Fluxes
High-frequency concentration data from transient events enables analysis approaches that improve flux calculation accuracy compared to linear regression methods developed for steady-state conditions. During emission pulses, concentration increases often follow non-linear patterns reflecting changing soil gas production or transport as chamber conditions evolve. Exponential or polynomial curve fitting better represents this behaviour and reduces systematic bias in calculated fluxes.
The detailed temporal information also supports mechanistic interpretation of emission patterns. Time to peak flux following an event trigger indicates the lag between environmental change and biological response. Decay rate from peak to baseline reflects gas consumption processes or diffusion limitation. Comparing these dynamic patterns across treatments or sites reveals differences in mechanisms controlling emissions that cannot be inferred from integrated flux values alone.
For studies involving multiple transient events over extended periods, careful attention to baseline flux characterization improves interpretation. Subtracting pre-event baseline fluxes from event peak values isolates the emission pulse magnitude directly attributable to the triggering mechanism. Integrating above-baseline emissions over event duration quantifies total pulse emission for comparison across events or calculation of event-driven contribution to annual budgets.
Quality assurance for high-frequency data requires automated screening procedures that flag instrument issues, chamber leaks, or environmental artifacts. Sudden concentration drops indicating chamber leakage, unrealistic flux values exceeding biological or physical constraints, and systematic drift in baseline readings all require identification and handling to maintain data integrity. Real-time data visualization during field campaigns enables immediate detection of problems and corrective action before measurement windows close.
Standards and Measurement Confidence
Accurate characterization of transient soil emission events requires measurement systems that combine high temporal resolution with stable, sensitive gas analysis. The scientific understanding of soil-atmosphere gas exchange increasingly recognizes that episodic events dominate emission budgets for many gases and ecosystems. Capturing these events accurately demands instruments capable of sustained high-frequency operation under demanding field conditions.
ABB-LGR analyzers provide the measurement capabilities that environmental researchers require for addressing questions about transient emission dynamics. The combination of laser spectroscopy sensitivity, fast response time, and field-proven reliability enables research programs that were impractical or impossible with previous measurement technologies.
Barnett Technical Services takes immense pride in being an Authorized Distributor of ABB-LGR instruments, supporting researchers with proven gas analysis solutions, application knowledge, and comprehensive technical support. With the right instrumentation and expertise, environmental scientists can confidently characterize the full spectrum of soil emission dynamics, from subtle baseline variations to dramatic transient pulses, advancing understanding of terrestrial greenhouse gas cycling and supporting development of effective climate mitigation strategies.
LGR-ICOS Analyzers for Transient Event Capture
| Analyzer Model | Target Gases | Key Advantages for Transient Events |
| LGR-ICOS™ GLA132-GGA | CH₄, CO₂, H₂O | Measurement rates up to 1 Hz, multi-gas simultaneous detection, rugged field deployment |
| LGR-ICOS™ GLA131-GGA | CH₄, CO₂ | Ultra-portable (< 6 kg), fast response, battery operation for remote events |
| LGR-ICOS™ GLA151-N2OCM | N₂O, CO, H₂O | Measurement rates up to 1 Hz, <8 sec response time, high-sensitivity N₂O for fertilizer pulses |
| LGR-ICOS™ GLA451-N2OI2 | N₂O, δ¹⁵N, δ¹⁸O, CO₂ | Isotopic source attribution, nitrogen pathway discrimination, agricultural source studies |
Ready to implement real-time gas flux analysis for your transient event studies? Contact us to discuss which LGR-ICOS analyzer configuration meets your research requirements. Our team provides application consultation, deployment planning, and ongoing technical support for soil flux measurement programs.
References
- Barton, L., et al. “Nitrous oxide emissions from a cropped soil in a semi-arid climate.” Global Change Biology 14.1 (2008): 177-192.
https://doi.org/10.1111/j.1365-2486.2007.01474.x - Butterbach-Bahl, K., et al. “Nitrous oxide emissions from soils: how well do we understand the processes and their controls?” Philosophical Transactions of the Royal Society B 368.1621 (2013): 20130122.
https://doi.org/10.1098/rstb.2013.0122 - Davidson, E.A., et al. “The contribution of manure and fertilizer nitrogen to atmospheric nitrous oxide since 1860.” Nature Geoscience 2.9 (2009): 659-662.
https://doi.org/10.1038/ngeo608 - IPCC. “2019 Refinement to the 2006 IPCC Guidelines for National Greenhouse Gas Inventories.” Chapter 11: N₂O Emissions from Managed Soils, and CO₂ Emissions from Lime and Urea Application.
https://www.ipcc-nggip.iges.or.jp/public/2019rf/index.html - Öquist, M.G., et al. “The full annual carbon balance of boreal forests is highly sensitive to freeze/thaw timing.” Environmental Research Letters 9.4 (2014): 044001.
https://doi.org/10.1088/1748-9326/9/4/044001 - Risk, N., et al. “Mechanisms leading to enhanced soil nitrous oxide fluxes induced by freeze–thaw cycles.” Canadian Journal of Soil Science 93.4 (2013): 401-414.
https://doi.org/10.4141/cjss2012-071 - Scheer, C., et al. “Nitrous oxide emissions from fertilized, mowed grassland are affected by the application of nitrification inhibitors.” Agriculture, Ecosystems & Environment 123.1-3 (2008): 177-185.
https://doi.org/10.1016/j.agee.2007.06.006 - Snyder, C.S., et al. “Review of greenhouse gas emissions from crop production systems and fertilizer management effects.” Agriculture, Ecosystems & Environment 133.3-4 (2009): 247-266.
https://doi.org/10.1016/j.agee.2009.04.021 - Wagner-Riddle, C., et al. “Globally important nitrous oxide emissions from croplands induced by freeze–thaw cycles.” Nature Geoscience 10.4 (2017): 279-283.
https://doi.org/10.1038/ngeo2907