
Real-Time Wavefront Phase Mapping of Transparent Optical Components and Thin Films Using the SEBI® RT1000
In optical inspection and metrology, imaging systems conventionally record light intensity to assess sample quality, surface condition, or structural uniformity. While intensity-based imaging is well suited for detecting gross defects or surface contamination, it is inherently blind to phase information, the component of light that encodes optical path differences, refractive index variations, and wavefront distortions across a sample.
This limitation is most consequential when working with transparent materials, precision optical components, and thin films, where the features of interest are often optically transparent and produce little to no contrast in a standard intensity image. A surface height variation of a few nanometers, a refractive index gradient across a thin film, or a thermally induced wavefront distortion may be entirely invisible under conventional imaging, yet each of these can significantly affect optical performance.
Traditional approaches to characterizing such features typically require offline analysis, contact profilometry, or interferometric setups that are sensitive to vibration, require careful alignment, and cannot be operated in real time during a dynamic process. As a result, process-induced changes in optical properties are often identified only after measurement is complete or not at all.
A method capable of recovering quantitative phase information directly from a standard imaging setup, in real time, without additional optical components between the sample and detector, would substantially expand the capabilities available for both research and production-line optical metrology.
Objective
The objective was to evaluate the SEBI® RT1000 wavefront phase camera as a tool for detecting and mapping nanometric-to-micrometric scale optical path variations in transparent optical components and thin film samples in real time. Specifically, the goal was to demonstrate that wavefront phase reconstruction using Wavefront Phase Imaging (WFPI) technology could reveal surface and bulk optical variations not detectable through intensity imaging alone, and to assess the system’s suitability for monitoring dynamic processes such as thermal deformation and time-dependent refractive index changes.
Experimental Setup
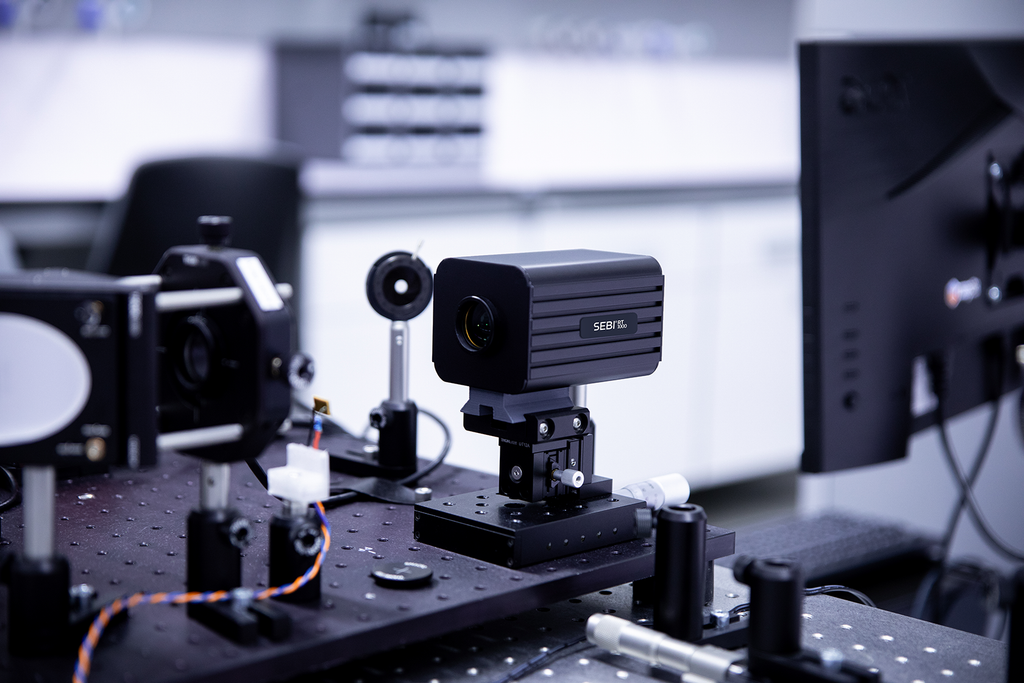
The SEBI® RT1000 is a compact wavefront phase sensor developed by Wooptix, implementing the company’s proprietary WFPI technology. Unlike Shack-Hartmann sensors or pyramid wavefront sensors, the SEBI® RT1000 contains no microlens array or additional optical element between the lenses and the detector. This design preserves the full spatial resolution of the imaging detector for wavefront reconstruction, enabling lateral resolution on the order of microns and phase amplitude resolution at the nanometer scale.
The operating principle is based on a curvature sensing approach. An electrically tunable lens (ETL) is used to sequentially capture two intensity images one slightly before and one slightly after the focal plane. These two defocused images are processed by the WFPI algorithm, which reconstructs the wavefront slope across the full detector field by comparing pixel-by-pixel light distribution between the two acquisitions. From this, a quantitative two-dimensional phase map is generated representing the optical path difference (OPD) across the sample.
Key specifications of the SEBI® RT1000:
- Wavefront phase spatial sampling: 1,000 × 1,000 pixels
- Real-time processing speed: 30 frames per second (FPS)
- Absolute wavefront accuracy: < λ/30 RMS
- Measurement range: nanometric to micrometric scale OPD
- Compatible with transmissive and reflective sample configurations
Samples were assessed in both transmission and reflection modes. For transmissive samples including flat optical windows, thin film coatings, and lens elements the SEBI® RT1000 was configured in-line with the sample illuminated by a collimated source. The wavefront phase exiting the sample was captured and reconstructed to reveal optical path differences introduced by refractive index gradients, surface form errors, or coating non-uniformities.
For dynamic measurements, samples undergoing controlled thermal loading were monitored continuously at 30 FPS, with phase maps recorded over time to track wavefront evolution during heating and cooling cycles.
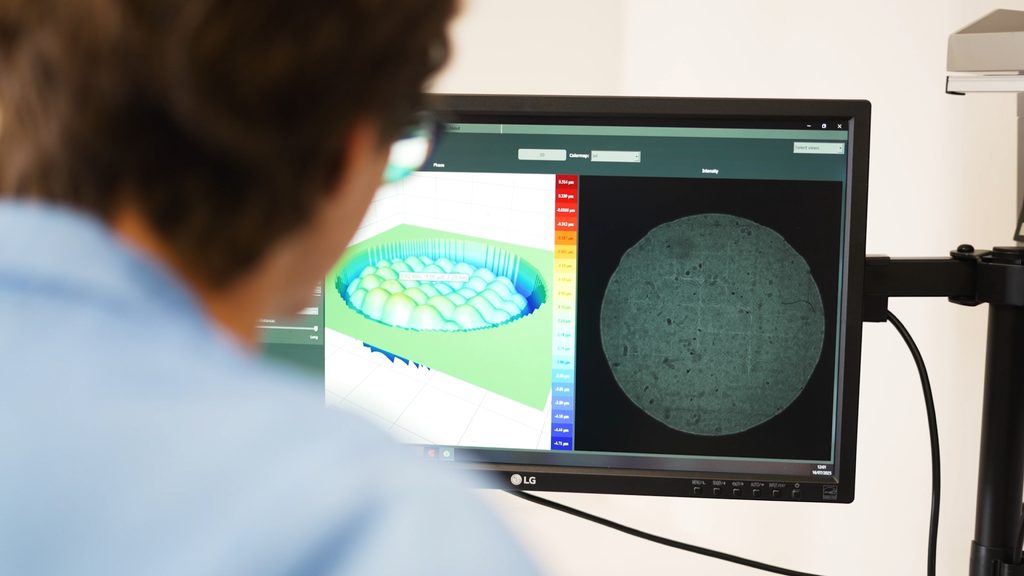
All image acquisition and phase reconstruction was performed using the SEBI® Analyzer Suite (SEBI® AS), the integrated software platform provided with the system. The suite enables customizable data extraction workflows, phase map visualization, temporal tracking, and export for further analysis.
Results
Phase mapping of transparent optical components
Intensity images of optically polished flat windows and thin film samples showed no detectable contrast across the field of view, consistent with the absence of gross surface defects or contamination. Wavefront phase maps generated by the SEBI® RT1000, however, revealed spatial variations in optical path difference at the nanometer scale including localized surface form deviations, coating thickness gradients, and low-spatial-frequency wavefront errors not resolvable through intensity imaging.
These variations, if undetected, would contribute directly to wavefront aberration in downstream optical systems, yet remain entirely invisible to conventional camera-based inspection.
Real-time monitoring of thermally induced wavefront distortion
During controlled thermal loading of an optical element, the SEBI® RT1000 captured phase maps continuously at 30 FPS. The resulting time-resolved phase data showed a progressive, spatially non-uniform wavefront distortion evolving in direct correlation with the applied thermal gradient. Localized OPD changes at the sub-wavelength level were tracked through the full thermal cycle, from initial heating through equilibrium and subsequent cooling.
This demonstrated the system’s capability to capture transient optical behavior in real time a measurement regime not accessible to offline interferometric methods or post-process surface analysis.
Detection of thin film coating non-uniformity
For coated optical substrates, phase maps revealed coating thickness variations across the sample area that produced corresponding OPD gradients. The spatial distribution of these variations was mapped at 1,000 × 1,000 resolution, providing a full-field, quantitative picture of coating uniformity without requiring physical contact with the sample surface.
Conclusions
This application demonstrates that the SEBI® RT1000, using Wavefront Phase Imaging technology, provides quantitative, full-field optical path difference measurements at nanometric sensitivity in real time – a capability not achievable with conventional intensity-based imaging systems.
Key findings from this evaluation:
- Nanometric surface and bulk optical variations in transparent components and thin films, invisible in standard intensity images, were successfully detected and spatially mapped at 1,000 × 1,000-pixel resolution.
- Dynamic, time-resolved wavefront monitoring at 30 FPS captured thermally induced optical distortions as they evolved enabling in-process characterization that offline methods cannot provide.
- Non-contact, non-destructive measurement in both transmissive and reflective configurations make the system adaptable to a wide range of sample types without modification to the sample or the optical path.
- The absence of a microlens array in the SEBI® RT1000 design preserves full detector resolution for wavefront reconstruction a structural advantage over Shack-Hartmann sensors in applications requiring high lateral resolution.
The combination of real-time operation, high phase sensitivity, compact form factor, and compatibility with existing optical setups positions the SEBI® RT1000 as a practical tool for both research-grade quantitative phase imaging and production-environment optical metrology
Steve’s Solution
This Steve’s Solution illustrates how the SEBI® RT1000, based on Wooptix’s patented Wavefront Phase Imaging technology, can be applied to optical component and thin film characterization where conventional intensity imaging is insufficient. The system’s real-time wavefront reconstruction capability, operating at 30 FPS with λ/30 RMS accuracy and 1,000 × 1,000 phase sampling, addresses a class of measurement challenges that have historically required offline, contact-based, or vibration-sensitive interferometric methods. For application-specific performance data, demonstration datasets, or integration guidance, contact Barnett Technical Services or visit the Wooptix product page directly.