Ramanomics: Quantification of Proteins, Nucleic Acids, and Lipids Inside Eukaryotic Cells
Molecular function in eukaryotic cells can be studied by quantifying proteins, nucleic acids, and lipids inside intracellular organelles. Traditionally, this quantification is performed through techniques that are given “-omic” terms such as proteomics, metabolomics, lipidomics, etc. using mass spectrometry (MS)-based techniques.
Raman spectroscopy has traditionally been used to quantify the molecular structure of a wide range of chemical species with size ranges from near-field (<100 nm) to bulk measurements. Extensive work has gone into the application of Raman spectroscopy in many biochemical applications but successful solutions have often been difficult due to the complexity of the information obtained in the measurement and interferences arising from the laser-based methods used for Raman spectroscopy. Dr. Andrey Kuzmin of the University at Buffalo and Advanced Cytometry Instrumentation Systems, LLC, has successfully bridged this gap with the application of Raman spectroscopy to the quantification of intracellular components. His development, termed “Ramanomics” can be used to quantify proteins, DNA, RNA, and lipids in live cells.
Traditionally, the quantification of chemical components in a complex system is performed by a chemometrics method that is used to predict the quantity of these components. One of the most common methods, Principal Component Analysis (PCA), relies on a series of standards to generate spectra used to model the solution. However, the implicit nature of this method means that even PCA-based solutions are very difficult to implement for the quantification of biomolecular constituents. The extension of PCA to incorporate specific knowledge about biochemical components in a cell and their interactions with Raman lasers leads to Biomolecular Component Analysis (BCA) that can identify the composition of cellular components in single organelles.
As a comparison between BCA and PCA, Figure 1 (below) shows the results obtained from PCA analysis of a HeLa cell line and the equivalent BCA analysis.1 Figures 1b and 1c show that some between the nucleolus and mitochondria can be seen in the PC1 vs. PC2 plot, but there is no separation at PC3 vs. PC4. Conversely the BCA analysis shown in Figures 1d and 1e illustrate strong separation in RNA vs. protein concentrations for the nucleolus and mitochondria (1d) and strong correlations glycogen or lipids vs. protein concentration in these organelles (1e).
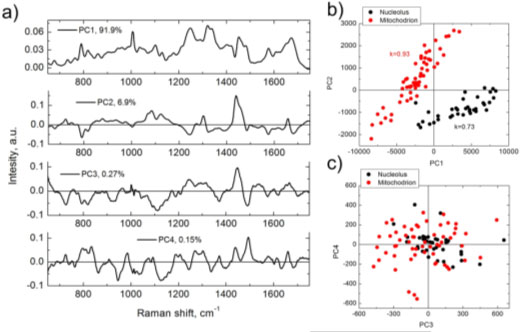
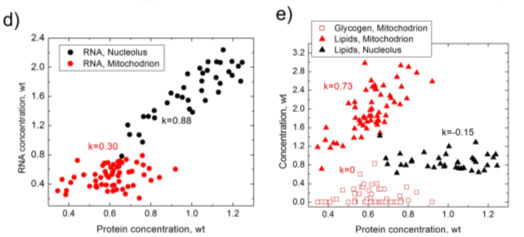
Figure 1. Results of PCA (a–c) and BCA (d,e), obtained from the same set of Raman spectra measured in nucleoli (black) and mitochondria (red) of HeLa cells. (a) first four principal components nucleoli (black) and mitochondria (red) of HeLa cells. (c) PC3 versus PC4 score versus PC4 score distribution; (d) RNA versus proteins concentration; (e) lipid/glycogen distribution; (d) RNA versus proteins concentration; (e) lipid/glycogen concentrations versus protein concentrations versus protein concentration. k is Pearson correlation coefficient.
Weight units concentration. k is Pearson correlation coefficient. Weight units correspond to 100 mg/mL for proteins and 20 mg/mL for RNA, lipids and glycogen.
Procedure
The procedure for performing Ramanomics measurements may be seen in the video below:
Instrumentation
At the University of Buffalo, this work was developed on the Confotec MR200 Raman microscope using 633 nm excitation. Details on this system may be found here. In North America, these systems are offered as the Ostec RAMOS E200 Raman microscope which are sold by Barnett Technical Services.
BCAbox
The Ramanomics measurements are performed with the BCAbox software that is used to calculate the quantity of proteins, nucleic acids, and lipids inside intracellular organelles. This software may be also added to existing Raman systems (depending on the specifics of the Raman system configuration).
For more information on Ostec Raman systems or the BCAbox software, please contact us.
Conclusion
Ramanomics represents a relatively new technique for quantifying proteins, nucleic acids, and lipids inside intracellular organelles. The ability to perform these measurements on live cells is valuable for the study of biochemical processes.
References
- Kuzmin, A.N.; Pliss, A.; Prasad, P.N. Ramanomics: New Omics Disciplines Using Micro Raman Spectrometry with Biomolecular Component Analysis for Molecular Profiling of Biological Structures. Biosensors 2017, 7, 52. https://doi.org/10.3390/bios7040052
Steve’s Solutions
To see more Ostec techologies in action, visit the Steve’s Solutions articles featuring this instrument.
 | Ramanomics: Quantification of Proteins, Nucleic Acids, and Lipids Inside Eukaryotic Cells |
| FTIR for Industrial Process Monitoring |
For More information
Ostec page
Ostec RAMOS E200 Raman microscope

Contact Us Online Form
Phone: 916-897-2441
Email: info@Barnett-Technical.com