Measuring the Thermal Conductivity of Thermoplastics with Conductive Fillers as Thermal Interface Materials (TIM) Using the Hot Disk TPS Method
Background
Thermoplastics are widely used as Thermal Interface Materials (TIM) across electronics, automotive, and industrial applications because they are lightweight, cost-effective, and easy to process into complex geometries. However, their low thermal conductivity remains a major limitation in heat-sensitive applications. Most thermoplastics typically exhibit thermal conductivity values between 0.1 and 0.5 W/m•K, significantly lower than metals such as aluminum at approximately 200 W/m•K.
As electronic devices become smaller and power densities increase, efficient thermal management has become increasingly important. To improve heat transfer performance, engineers often incorporate thermally conductive fillers into thermoplastics. These fillers create thermally conductive pathways within the polymer matrix, helping heat move more efficiently through the material. However, the resulting thermal performance depends on factors such as filler type, particle geometry, concentration, dispersion quality, and polymer compatibility.
As conductivity improvements vary significantly across different material combinations and filler loading levels, accurate thermal characterization becomes essential during material development. Conventional steady-state measurement methods can be time-consuming and less practical for rapid composite evaluation. In contrast, transient measurement techniques such as the Hot Disk Transient Plane Source (TPS) method provide faster and more versatile thermal conductivity analysis across a broad conductivity range. This makes the TPS method particularly useful for evaluating thermoplastic composites during material screening and optimization.
Objective
This study investigates the improvement in thermal conductivity of commodity thermoplastics through the addition of three types of conductive filler particles. The aim is to quantify the effect of filler type and concentration on thermal performance and validate the measurement approach using a Hot Disk thermal constants analyzer. Specifically, the study focuses on:
- Investigating the effect of adding conductive fillers to thermoplastics
- Quantifying improvements in thermal conductivity
- Comparing thermal performance of base materials with their modified counterparts
- Validating measurements using the Hot Disk TPS technique to ensure reliable, repeatable data.
Materials
Base polymers selected
Three general-purpose injection-molding grades were chosen to represent a range of common thermoplastic families:
- Polypropylene (PP): A semi-crystalline polyolefin widely used in consumer and industrial applications
- Polyamide (PA): Commonly used in engineering components where moderate heat and chemical resistance are required
- Polycarbonate (PC): A tough, transparent engineering polymer used frequently in electronics and optical applications
All three were commercially available grades, not experimental formulations. The intent was to evaluate performance improvements achievable with standard materials, which makes the findings directly applicable to industrial development programs.
Fillers used
Three types of thermally conductive particles were selected to represent different particle geometries and conductivity profiles:
- Aluminum powder: Coarse particles in the range of 200–800 µm with a near-spherical to slightly irregular morphology, representing a common metal-based conductive filler
- Copper powder: Finer particles in the range of 100–250 µm with morphology similar to aluminum, used to assess the effect of a higher-conductivity metal filler
- Graphite powder: Fine flake-shaped particles between 5–20 µm with a high specific surface area, enabling enhanced thermal pathway formation within the polymer matrix.
Each filler was incorporated at varying concentrations from 0 to 50 wt%, enabling a systematic comparison of loading effects across compositions.
Experimental Setup
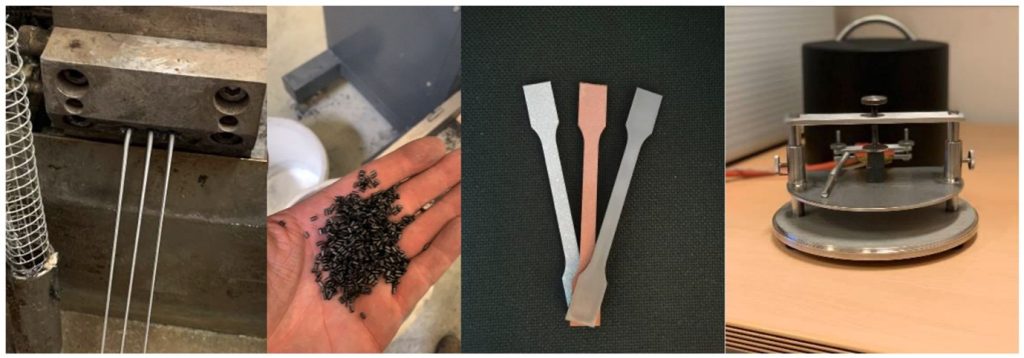
Image Credit: https://www.hotdiskinstruments.com
- Instrument Used: Thermal conductivity measurements were performed using the Hot Disk TPS 2200 thermal constants analyzer, based on the Transient Plane Source (TPS) method.
- Sample Preparation Method: Each thermoplastic composite was first compounded using a co-rotating twin-screw extruder to ensure uniform dispersion of conductive fillers within the polymer matrix. The extruded material was then pelletized, dried, and injection molded into standard tensile test specimens. For thermal testing, the shoulder sections of these molded samples were cut to obtain flat, parallel surfaces suitable for TPS measurement.
- Measurement Technique and Sensor Placement: The TPS method uses a thin, spiral-shaped resistive sensor embedded in a polymer film. During testing, the sensor is placed between two flat sample surfaces, ensuring direct and uniform contact on both sides. A controlled electrical pulse is applied through the sensor, generating heat, and the resulting temperature rise is recorded over time. Thermal conductivity is calculated based on the rate of heat dissipation into the surrounding material.
- Controlled Testing Conditions: To ensure accuracy and repeatability, all measurements were performed under controlled and consistent conditions. Special attention was given to maintaining:
- Clean and flat sample surfaces
- Consistent sensor placement and contact pressure
- Stable environmental conditions during testing
Three replicate measurements were taken for each composition, and the results were averaged to ensure reliability and reduce experimental variation.
Results and Discussion
As expected, it was generally observed that the thermal conductivity increased with the addition of fillers.
Polypropylene (PP) composites
The base PP used in this study measured a thermal conductivity of 0.23 W/m·K; consistent with published values for unfilled polypropylene. With the addition of conductive fillers, all composite systems showed a measurable increase in thermal conductivity, with the magnitude of improvement strongly dependent on filler type and loading level.
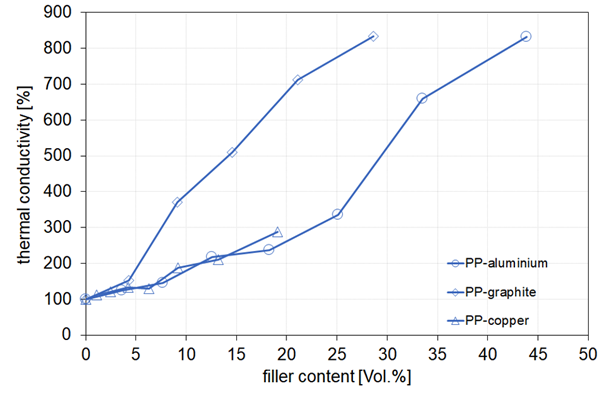
Image Credit: https://www.hotdiskinstruments.com
Relationship Between Filler Loading and Conductivity Improvement
The conductivity response followed a clear non-linear trend with increasing filler content.
- At lower filler loadings, thermal conductivity increased gradually and approximately linearly. At this stage, filler particles remain largely isolated within the polymer matrix, and heat transfer still depends primarily on the polymer phase.
- At higher loadings, the rate of improvement became more pronounced. As particle concentration increases, conductive pathways begin to form through particle-to-particle contact, reducing the dominance of the polymer matrix as the primary thermal resistance.
Effect of Fillers
Among the three fillers, graphite consistently delivered higher thermal conductivity improvements compared to both aluminum and copper powders at equivalent loadings. This behavior is primarily attributed to particle geometry and surface area effects.
Graphite’s flake-like structure provides a significantly higher aspect ratio and larger interfacial contact area with the polymer matrix, enabling more effective thermal pathway formation. In addition, flake alignment during injection molding may further enhance heat flow in the primary flow direction.
Metal powders, by comparison, exhibited more isotropic and spherical morphologies, which limited the formation of efficient interconnected thermal networks at similar loadings.
Effect of Polymer Matrix: Comparison of Different Material Compositions
When the same fillers were incorporated into PA and PC, the general trends were consistent with PP. Here are some observations.
- Conductivity increased with filler loading, graphite outperformed the metal powders at equivalent volume fractions, and the rate of improvement accelerated at higher concentrations.
- In case of the graphite-filled composites, both PC and PA showed higher thermal conductivity improvements than PP at the same graphite loading levels. This reason relates to interfacial wetting.
- PC and PA both contain polar functional groups capable of hydrogen bonding, which improves the compatibility and interaction between the polymer matrix and the graphite surface.
- PP, being a non-polar polyolefin, wets graphite less effectively, leaving a more resistive polymer-filler interface. Better interfacial contact means more efficient heat transfer across the boundary between matrix and filler.
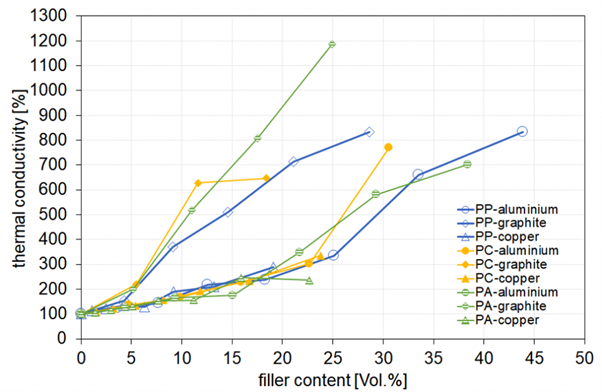
Image Credit: https://www.hotdiskinstruments.com
Quantitative Outcomes
The most significant result from this study was a tenfold improvement in thermal conductivity achievable with the right polymer-filler combination at sufficient loading.To put that in concrete terms:
Graphite at approximately 20 wt% loading (equivalent to roughly 11 vol%) produced the following results:
- PC with graphite: 1.48 W/m·K (versus 0.23 W/m·K for unfilled PC)
- PA with graphite: 1.16 W/m·K (versus 0.23 W/m·K for unfilled PA)
These values represent up to a tenfold improvement over the base polymers. While not a replacement for metallic heat spreaders, these conductivity levels are sufficient for many thermal management applications where structural integrity, weight reduction, and processability are also important design constraints.
Comparison Table
A comparison of the results across the three polymers is shown in the table below:
| Property | Polypropylene (PP) | Polyamide (PA) | Polycarbonate (PC) |
| Polymer Type | Semi-crystalline polyolefin | Semi-crystalline engineered polymer | Amorphous engineered polymer |
| Common Applications | Consumer goods, packaging, automotive parts | Mechanical components, gears, housings | Electronics, optical parts, enclosures |
| Base Thermal Conductivity | ~0.23 W/m·K | ~0.23 W/m·K | ~0.23 W/m·K |
| Filler Compatibility | Lower (weaker interaction with fillers like graphite) | Good (hydrogen bonding improves interface) | Good (strong interfacial interaction) |
| Response to Filler Addition | Moderate improvement | Strong improvement | Strongest improvement observed |
| Graphite Performance | Effective but limited by poor wetting | High improvement due to better dispersion and interface | Highest conductivity gains due to strong matrix-filler interaction |
| Typical Conductivity at ~20 wt% Graphite | <1 W/m·K (lower than PA and PC) | ~1.16 W/m·K | ~1.48 W/m·K |
| Key Insight | Cost-effective but less efficient for thermal pathways | Balanced performance and thermal enhancement | Best candidate for high-performance thermal applications |
TPS Method Performance: Validation for Polymer Composite Analysis
The Hot Disk TPS 2200 demonstrated stable and repeatable performance across all tested materials, covering a wide conductivity range from unfilled polymers (~0.23 W/m•K) to highly filled composites exceeding 1.5 W/m•K.
Key observations include:
- Low variation across replicate measurements
- No need for instrument or sensor changes across material types
- Reliable performance across low and high conductivity regimes
This confirms that the TPS method is well suited for rapid screening and development of thermally conductive polymer composites, particularly where multiple formulations and filler loadings must be evaluated efficiently.
Key Observations
A few findings from this study are worth emphasizing for engineers working on thermally conductive polymer development:
- Filler geometry is as important as filler conductivity. Despite having lower bulk thermal conductivity than aluminum or copper, graphite outperformed both metals in these composites.
- Particle size and shape are primary variables. Smaller, higher-aspect-ratio particles provide more surface area and build conductive networks more efficiently at lower volume fractions.
- Polymer-filler compatibility influences results at the interface. PP’s non-polar character limited the efficiency of graphite incorporation compared to PA and PC.
- For engineers selecting a base polymer for a filled composite, compatibility with the chosen filler is a relevant selection criterion, aside from processing characteristics and mechanical properties.
- Thermal conductivity does not scale linearly with filler loading. Early-stage trends can underestimate performance at higher loadings, making full-range characterization essential for accurate material prediction and design decisions..
The TPS method demonstrated good repeatability, with three replicates per composition providing reliable results when consistent surface preparation is maintained. This makes it suitable for iterative material development workflows where time and sample volume are constrained.
Conclusions
This study demonstrates that adding conductive fillers is an effective method for significantly enhancing the thermal conductivity of commodity thermoplastics, with improvements reaching up to an order of magnitude under optimized conditions. The extent of enhancement is primarily governed by filler type, loading level, and polymer–filler interfacial compatibility, with graphite-based systems showing the strongest performance due to favorable geometry and surface area effects. The Hot Disk TPS 2200 has proven to be a reliable and repeatable method for thermal conductivity measurement across all compositions. Overall, the modified materials show strong potential for use in thermal management applications across electronics, automotive, and industrial systems.
Steve’s Solutions
This Steve’s Solution was developed based on thermal conductivity analysis of thermoplastic composites using the Hot Disk TPS method. The study demonstrates how conductive fillers such as graphite, aluminum, and copper can significantly improve heat transfer performance in polymer materials for advanced thermal management applications.
To explore more innovative applications and engineering case studies, visit the Steve’s Solutions page.
Related Products: